Fig. 2.

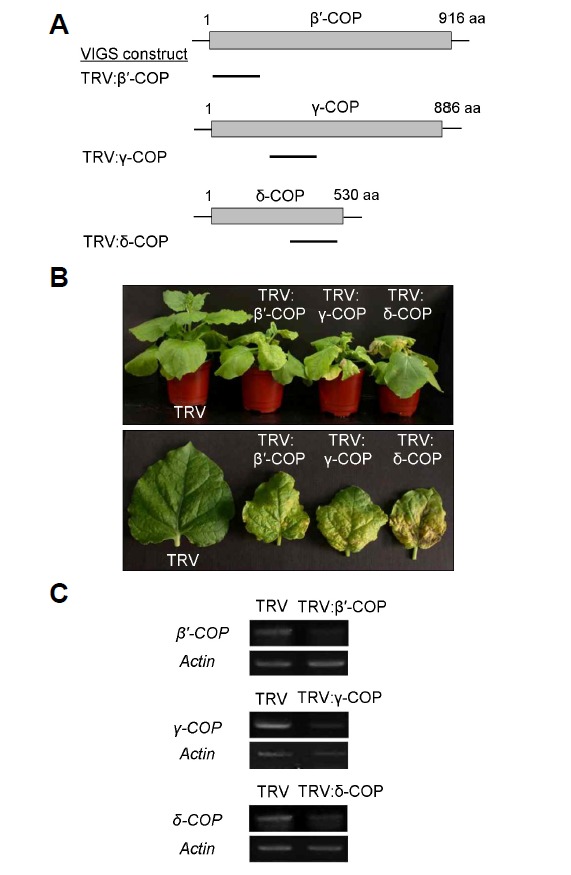
Virus-induced gene silencing (VIGS) of COPI subunit genes in N. benthamiana. (A) Schematic drawing of N. benthamiana β′-, γ-, and δ-COP genes and VIGS constructs. Bars indicate cDNA fragments of each gene cloned into the TRV vector. (B) VIGS phenotypes of β′-, γ-, and δ-COP in comparison with the TRV control phenotype. The whole plants (top) and individual leaves (bottom) are shown at 20 days after infiltration (DAI). (C) Semiquantitative RT-PCR to detect endogenous transcript levels. The actin mRNA level was used as control. Total RNA was prepared from leaves collected from >6 independent VIGS plants. RT-PCR was performed three times, and a representative gel image is shown.
