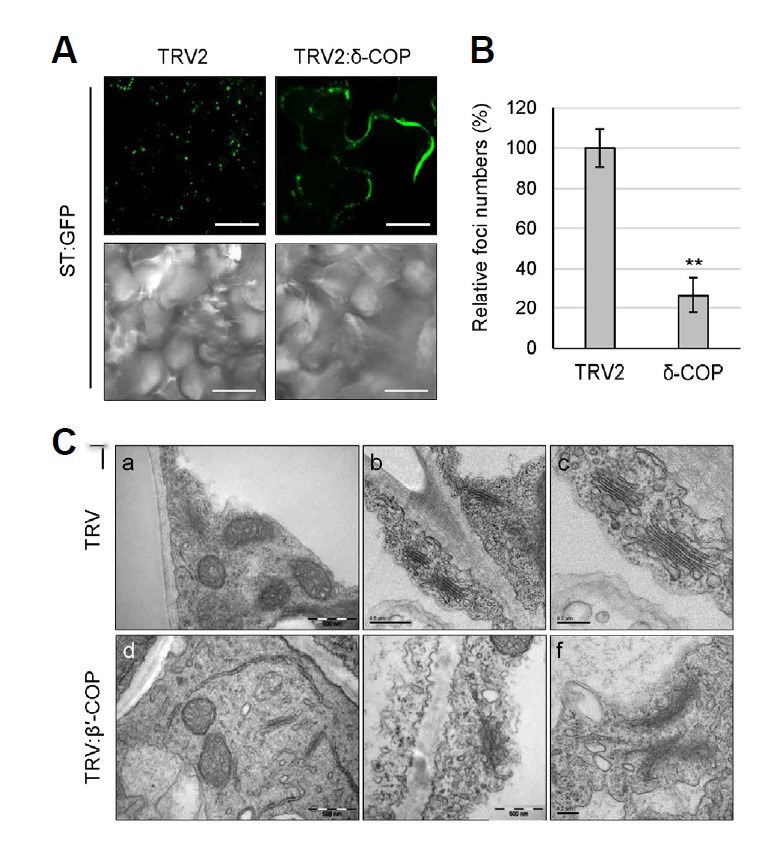
Fig. 4.

Disruption of Golgi structure in COPI deficient plants. (A) VIGS was performed with Arabidopsis δ-COP cDNA fragment in TRV2 vector using Arabidopsis transgenic plants expressing ST-GFP fusion protein as a Golgi marker. GFP fluorescence of leaf samples was observed by confocal microscopy at 12 DAI. Scale bars = 20 μm. (B) For quantification of the Golgi-specific foci shown in (A), z-sectioning images were taken serially at 0.5-µm intervals (10 images). After 3-dimensional (3-D) reconstruction, the foci were counted using ImageJ. Approximately 300 foci were counted for each 3-D image, and 9 leaf samples were analyzed for each VIGS line for statistical analysis. Foci numbers of TRV2:δ-COP VIGS plants were expressed relative to that of TRV2 control. Asterisks denote the statistical significance of the differences between TRV2:δ-COP and TRV2 control samples: *P ≤ 0.05; **P ≤ 0.01. (C) Morphology of the Golgi complex in the leaves of the N. benthamiana TRV:β′-COP VIGS plants (12 DAI) was observed by transmission electron microscopy (TEM). Scale bars = 0.5 μm in (a, b, d); 0.2 μm in (c, e, f).
