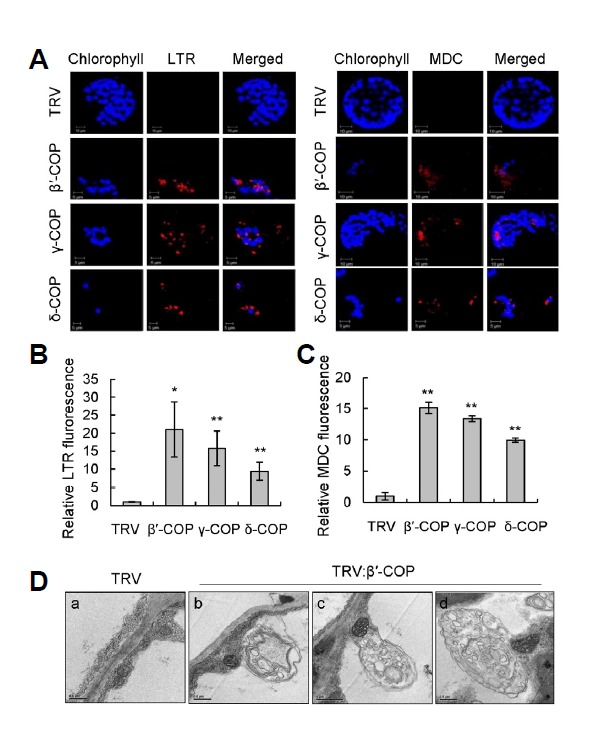
Fig. 5.

Detection of autolysosomal structures in COPI VIGS N. benthamiana plants.(A) Lysotracker red (LTR) and monodansylcadaverine (MDC) staining of leaf protoplasts isolated from TRV:β′-COP, TRV:γ-COP, and TRV:δ-COP VIGS plants at 12 DAI. Representative confocal images are shown. Scale bars = 5 μm. (B) LTR fluorescence of leaf protoplasts from COPI VIGS plants shown in (A) was expressed relative to that of TRV control. Data represent means ± SD of 30 individual protoplasts. Asterisks denote the statistical significance of the differences between COPI-silenced plants and TRV controls; *P ≤ 0.05; **P ≤ 0.01. (C) MDC fluorescence of leaf protoplasts from COPI VIGS plants shown in (A) was expressed relative to that of TRV control. Data represent means ± SD of 30 individual protoplasts. (D) Representative TEM images of the cytoplasm in mesophyll cells of TRV and TRV:β′-COP VIGS plants at 12 DAI. Scale bars = 0.5 μm in (a, b, d); 1 μm in (c).
