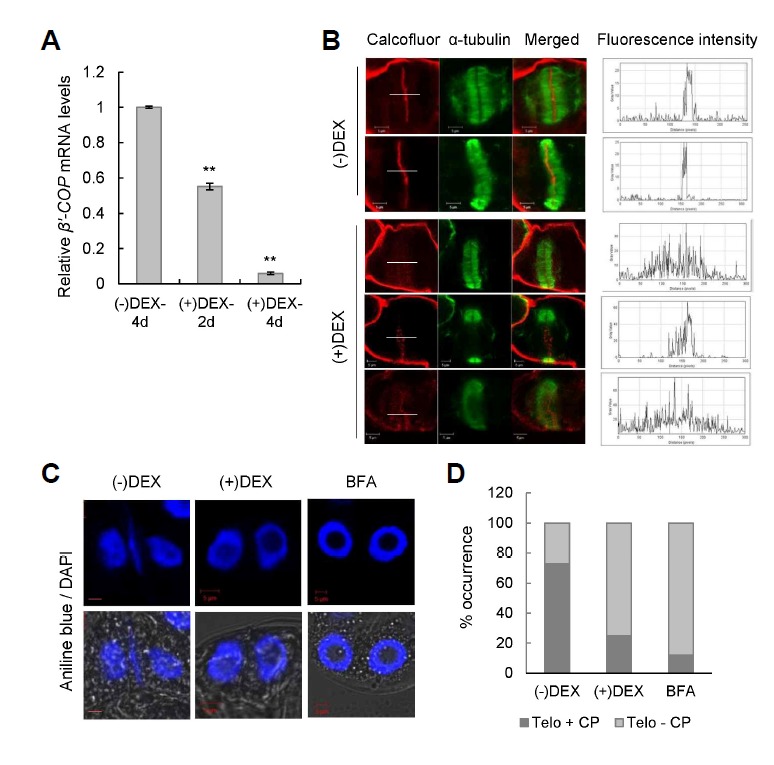
Fig. 6.

Defective cell plate formation in DEX-inducible β′-COP RNAi BY-2 cells. (A) Real-time quantitative RT-PCR was performed to determine the β′-COP mRNA level in the RNAi BY-2 cells after 2 days (2 d) or 4 days (4 d) of 15 µM DEX treatment. The transcript levels were expressed relative to that of BY-2 cells ethanol-treated for 4 days [(−)DEX-4 d]. Data points represent means ± SD of three replicate experiments; *P ≤ 0.05; **P ≤ 0.01. (B) BY-2 cells were double-labeled with calcofluor staining (pseudo-colored red) and anti-α-tubulin antibodies to visualize the cell plate and the phragmoplast, respectively, after 4 days of ethanol (-DEX) or DEX treatment. The right-most panels show the calcofluor fluorescence intensity profiles spanning the cell plate (white lines). Scale bars = 5 μm. (C) BY-2 cells were double-labeled with aniline blue and DAPI to visualize the cell plate and the nuclei, respectively. Representative telophase cells are shown. BY-2 cells were treated with 20 µM BFA as positive control. Scale bars = 5 μm. (D) Telophase cells with (Telo + CP) or without the newly forming cell plate (Telo - CP) shown in (C) were quantified (n = ∼80 for each sample). Values are expressed as percentage of total telophase cells counted.
