
Fig. 3.
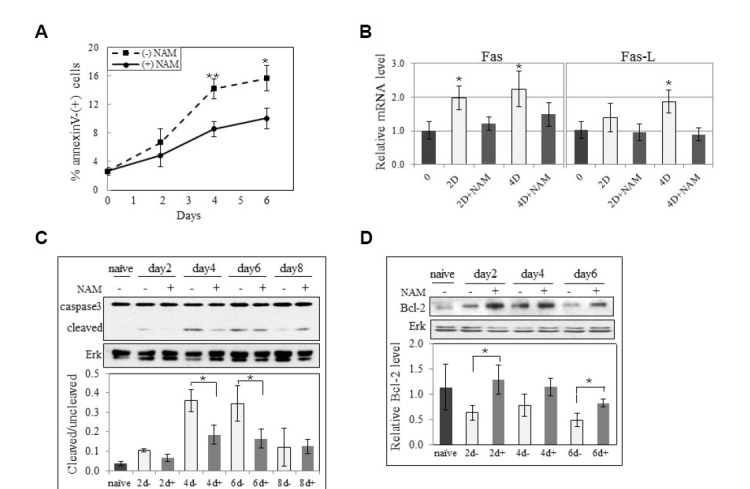
Effect of NAM on apoptosis during activation. (A) T cells activated in the presence (━•━) or absence (--▪--) of NAM were collected at days 2, 4, and 6, and probed with PI or FITC-annexin V, and applied to flow cytometry to determine % total annexin V-positive cells. The averaged numbers of two independent cultures are plotted. (*P < 0.1 and **P < 0.05 between the cells activated with or without NAM) (B) mRNA from T cells naïve or activated for 2 days (−/+NAM) were applied to qPCR for Fas or Fas ligand. Actin mRNA served a control. Mean values from 3 measurements of a biological sample are plotted. ((*P < 0.1 compared to naïve cells) (C, D) Proteins from cells either naïve or activated for 2, 4, 6, 8 days or 2, 4, 6 days in the absence or presence of NAM were applied to western analysis for caspase 3 and Erk (C), or Bcl-2 and Erk (D). Bands in two blots from one biological sample were quantified through densitometry, and mean values relative to that from naïve cells are plotted. (*P < 0.1 between the cells activated with or without NAM)