Figure 5.
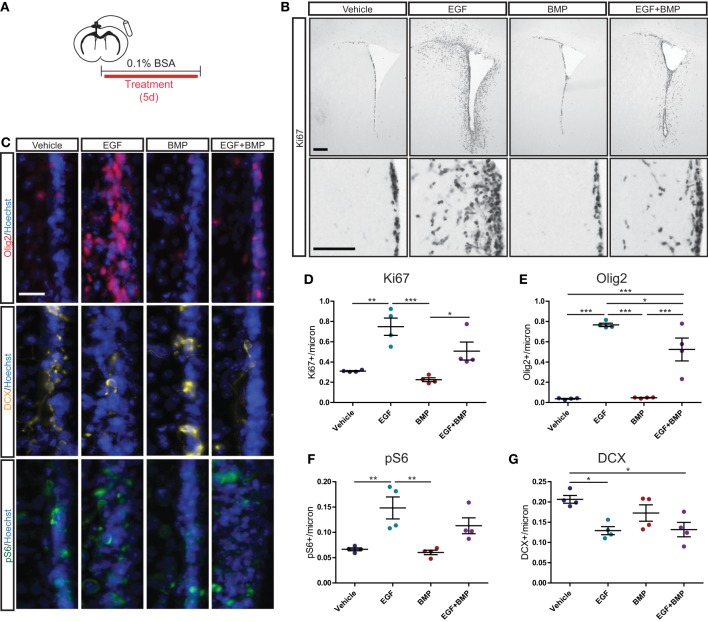
BMP limits EGF-induced expansion of TAPs in vivo. Intracerebroventricular infusion paradigm (see Materials and Methods for details) (A). Brightfield immunohistochemistry for Ki67, with low magnification (upper) and high magnification (lower) images of each condition (B). Immunofluorescence for Olig2 (upper), DCX (middle) and pS6 (lower), each counterstained with Hoechst (C). Quantification of Ki67+ (D), Olig2+ (E), pS6+ (F), and DCX+ (G) SVZ cells (N = 4/group). Scale bars: (B) top: 250 microns, (B) bottom: 100 microns, (C): 25 microns. *p < 0.05, **p < 0.01, ***p < 0.001, One-Way ANOVA (Tukey post-hoc test). Data are represented as mean ± SEM.

