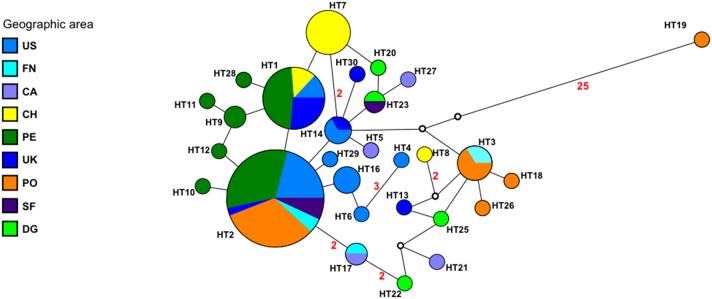
Figure 1.

Median-joining network of Y. ruckeri population. Colors indicate the different geographic area. Circles represent each haplotype (HT). A line between haplotypes represent one mutational step. Numbers on the lines indicate the number of mutational steps greater than one. Open circles represents haplotypes not present in the sample. Radius of the circle is proportional to the number of sequences.
