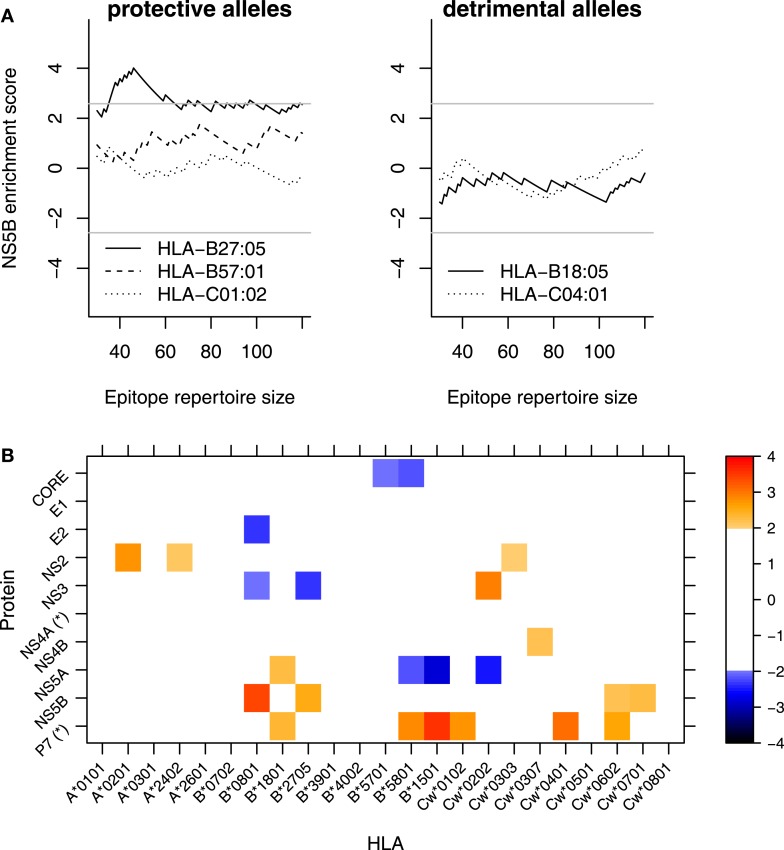
Figure 3.
HLA-B*27 targets the NS5B protein. (A) Enrichment score (standardized residual; explained in main text and Materials and Methods) as a function of the rank cutoff between epitopes and non-epitopes. For example, at a cutoff of 60, the epitope repertoire consists of the 60 best binders and the proportion of predicted epitopes from a given protein is compared with the proportion that would be expected based on the protein length. An enrichment score of 2 roughly corresponds to significance at α = 0.05 and a score of 2.58 corresponds to α = 0.01 (gray horizontal line). The top 60 binders correspond to the top 2% binders in HCV. (B) Matrix plot of enrichment scores per protein-HLA combination. Enrichment scores in each cell are averaged over cutoffs between 60 and 120 (or the top 2–4%). For clarity, all cells that would not be individually significant at the α = 0.05 are muted (white cells). *These proteins are shorter than 100 amino acids (aa). Therefore, the enrichment scores are based on only a few peptides. The protein lengths are CORE 191aa; E1 192aa; E2 363aa; P7 63aa; NS2 217aa; NS3 631aa; NS4A 54aa; NS4B 261aa; NS5A 448aa; and NS5B 591aa.

