Figure 4.
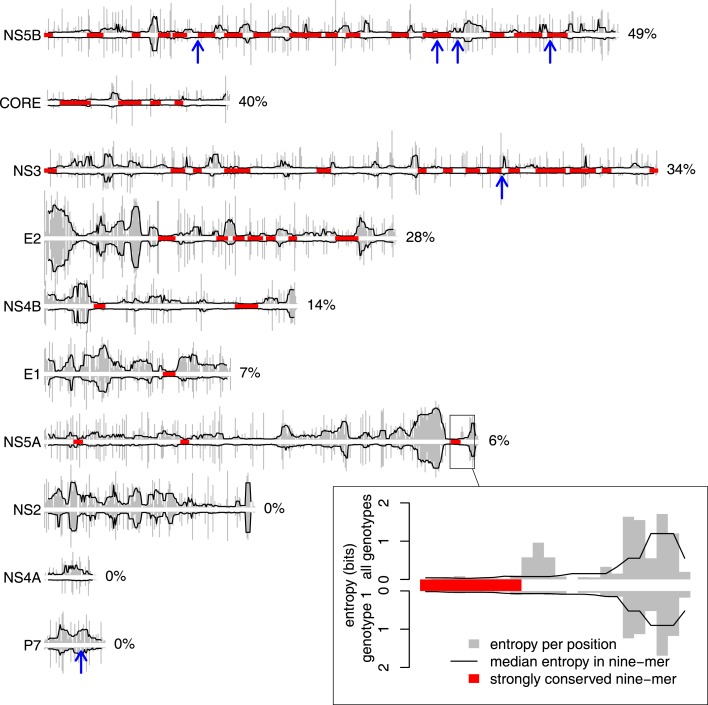
NS5B is the most conserved HCV protein. Protein variability was estimated using bias-corrected Shannon entropy scores calculated for each position in HCV protein alignments (see Materials and Methods). For each protein, the plot shows raw entropies (gray bars) and median entropies in nine-mers (black lines) estimated from all sequences (plotted upward) or genotype 1 sequences only (plotted downward; see inset for the scale). Blue arrows point to the centers of experimentally verified HLA-B*27 epitopes (see Figure 1). Strongly conserved nine-mers with low median entropy (see Materials and Methods and main text for details) are highlighted in red. According to the coverage by strongly conserved nine-mers (shown to the right of each plot), NS5B is the most conserved HCV protein (49%). The number of sequences per protein varies between 466 (NS5B) and 918 (NS3).

