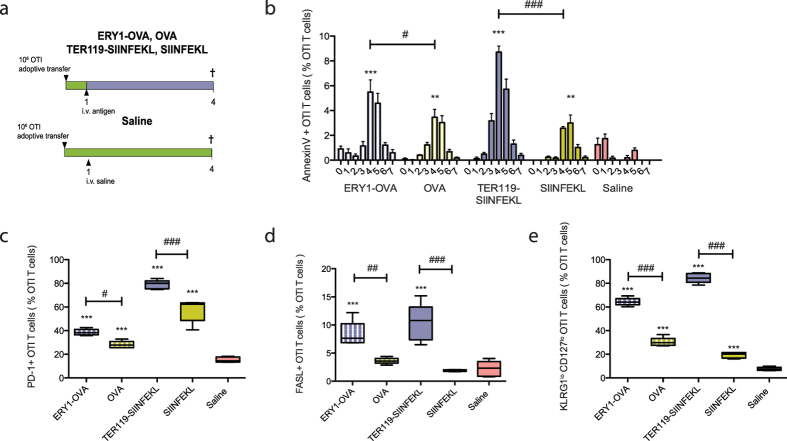
Figure 1. OTI T cell phenotypic markers expressions in response to soluble and erythrocyte-bound antigens.
(a) 106 CFSE-labeled OTI CD8+ T cells (CD45.1+) were adoptively transferred in C57BL/6 mice (CD45.2+) on day 0 and mice treated with erythrocyte-bound or free antigen or saline the next day. Here, the full OVA protein was used with the ERY1-OVA antigen form, compared to free OVA; and only the CD8+ T cell epitope SIINFEKL was used with the TER119-SIINFEKL antigen form, compared with free SIINFEKL peptide. Spleens were collected on day 4 for flow cytometric analysis. (b) AnnexinV binding per generation, (c) PD-1+, (d) FasL+ and (e) KLRG1lo CD127lo OTI T cells populations in the spleen on day 4. Data represent mean ± SD of n = 5. 1 way ANOVA *: respective to Saline group. *,#: < 0.05, **,##:< 0.01, ***,###: < 0.001..

