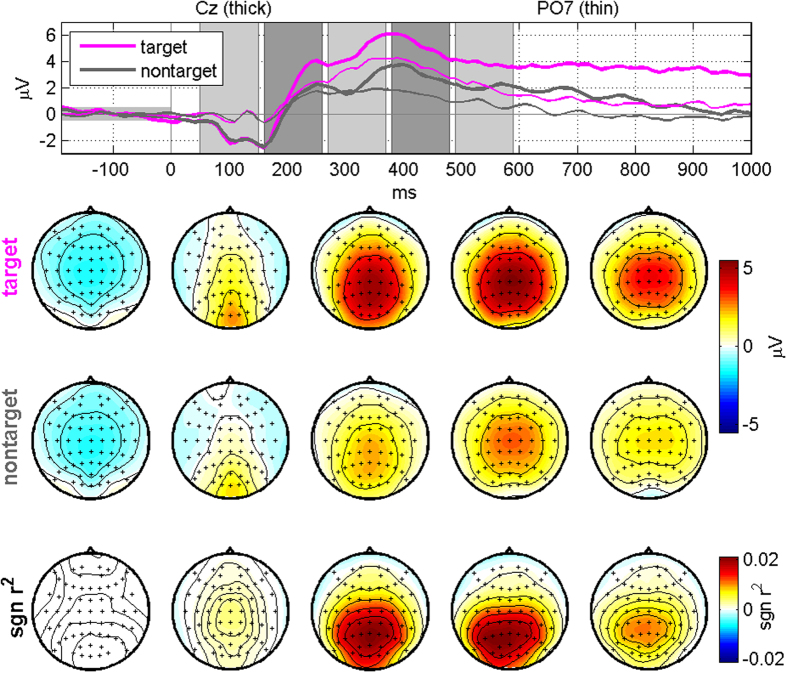
Figure 3. Grand-average ERPs for target and non-target stimuli and their differences in terms of the sgn r2 value along time after removing artifact components using ICA.
No significant eye movements are observed in the ERP maps, while P3 components are clearly seen. The topographic maps in each column correspond to the five time periods shaded in the top panel.

