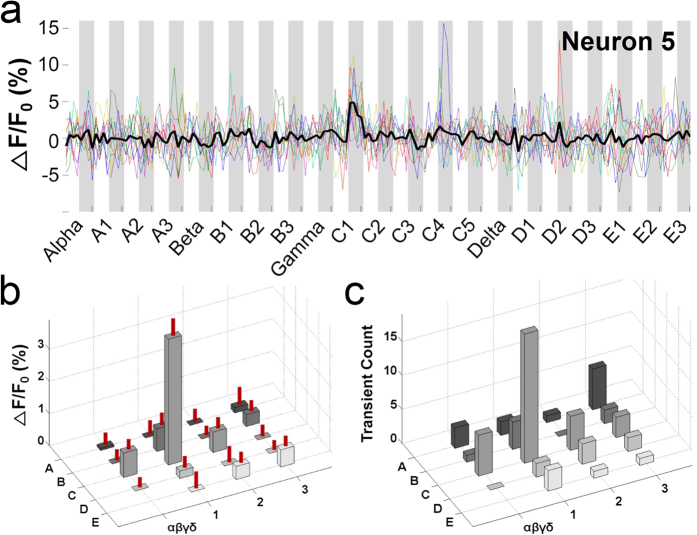
Figure 3. A neuron with sharp whisker tuning.
(a) Averaged Ca2+ signals of Neuron 5 in Fig. 2b in response to stimulation of 21 whiskers. Ten individual traces are shown in colour; the average trace is depicted by the thick black line and is superimposed over the individual traces. The image frames (512 × 512) were obtained at 0.76 Hz. The stimulated whiskers are listed on the x-axis in an arbitrary order. The shaded and unshaded regions indicate the on and off periods of stimulation. (b) Topographical 3D plot of Ca2+ signals against stimulated whiskers. The Ca2+ signals evoked by C1 stimulation were significantly larger than those evoked by stimulation of the other whiskers (one-way ANOVA, F(18,741) = 7.214, p < 0.001; Holm-Sidak method for multiple comparisons between the C1 response and the other responses, p < 0.001 for all pairs). The S.E.M. is indicated as a vertical red line on each bar. Negative Ca2+ signal values are represented as zero for clarity. (c) Topographical 3D plot of transient counts against stimulated whiskers. The transients were detected as Ca2+ signals that were larger than the threshold and that occurred during the on periods.

