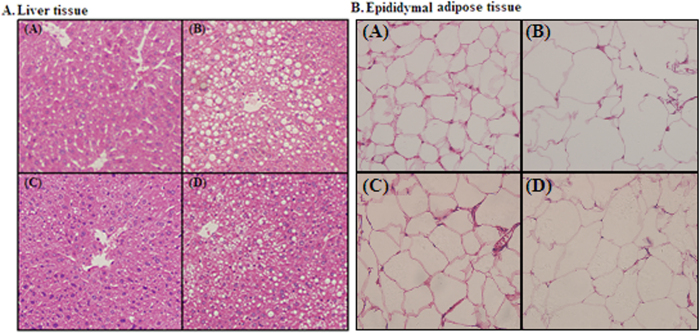
Figure 2. Histological examination of the liver tissue (100× ) and epididymal adipose tissue (400× ) of C57BL/6J mice following HE staining.
(A) Reference chow diet group; (B) High fat/cholesterol diet group; (C) High fat/cholesterol diet plus 0.8% oat fiber group; (D) High fat/cholesterol diet plus 0.8% wheat bran fiber group.

