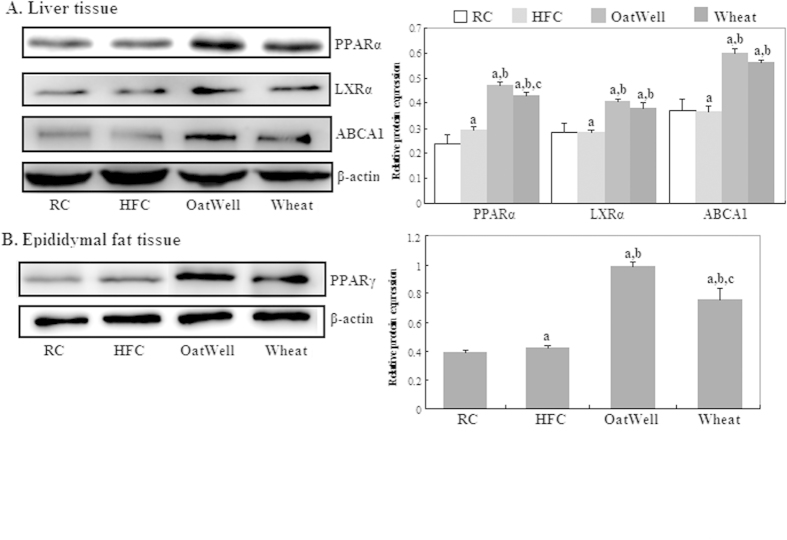
Figure 5. Effects of dietary fiber on protein expressions of PPARα, LXRα, ABCA1 and PPARγ in C57BL/6J mice fed a high fat/cholesterol diet for 24 weeks.
The intensity of the bands was quantified by densitometric analysis and normalized with corresponding β-actin. Results are calculated as the mean ± SD of six mice. RC, reference chow diet group; HFC, high-fat/cholesterol diet group; OatWell, HFC plus 0.8% oat fiber group; Wheat, HFC plus 0.8% wheat bran fiber group; PPAR, peroxisome proliferator activated receptor; LXRa, liver X receptor alpha; ABCA1, ATP-binding cassette transporter A1. ap < 0.05, vs mice fed with RC diet. bp < 0.05, vs mice fed with HFC diet. cp < 0.05, vs mice fed with OatWell diet.

