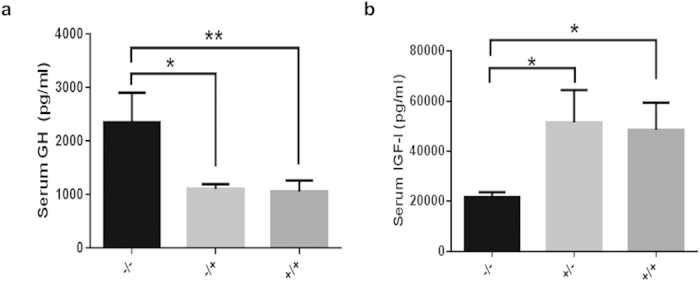
Figure 4. Growth retardation in the −/− pigs.

Determination of body weight (a), body length (b), chest circumference (c) and body height (d in the F2 generations suggests growth failure in the −/− pigs. The −/−, +/− (GHR+/4bp) and +/+ (GHR+/+) represent different genotypes in the F2 generation; the bars represent the means ± SD (at least three pigs per group); *P < 0.05.
