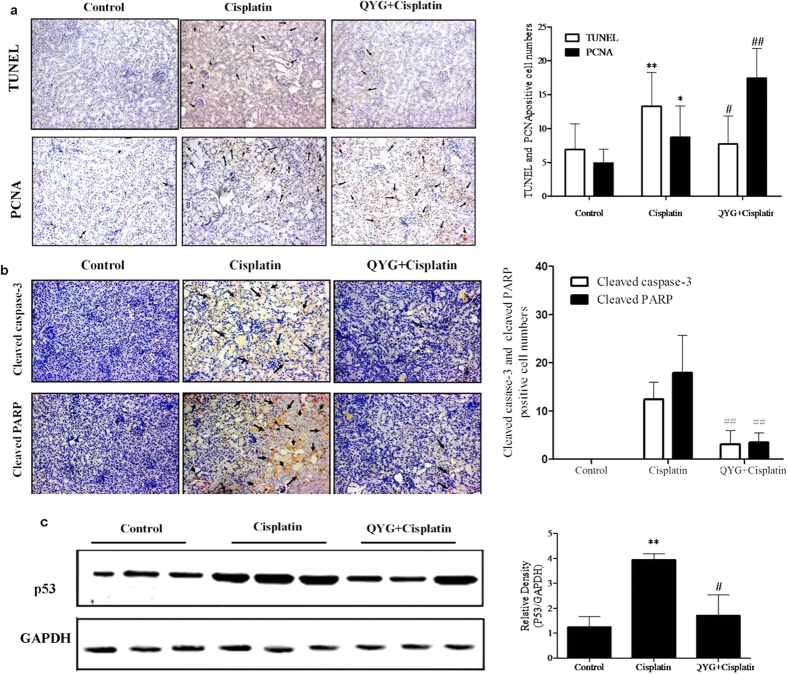
Figure 4. Effects of QYG on cisplatin-induced tubular apoptosis and tubular cell proliferation 3 days after cisplatin administration.
The animals were treated as indicated, after which fixed kidney tissue samples were analyzed by TUNEL staining and PCNA staining. (a) Representative images of TUNEL- and PCNA-stained kidney sections. (b) Expression of cleaved caspase-3 and cleaved PARP in the kidney was evaluated using immunohistochemistry. (c) Total protein expression of p53 in cisplatin-treated mice was evaluated by immunoblot analysis (n = 3 per lane). GAPDH was used as a loading control. *P < 0.05; **P < 0.01, in comparison with the control group; #P < 0.05; ##P < 0.01, in comparison with the cisplatin group.

