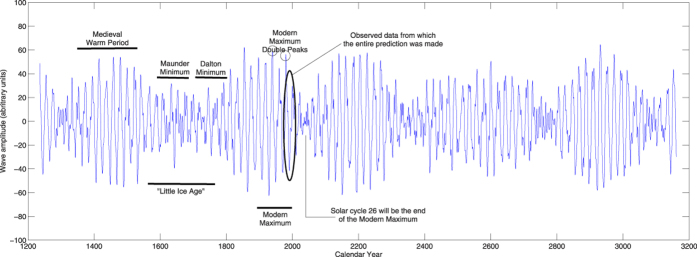
Figure 3. The predicted summary wave (the sum of two principal components) calculated from 1200 to 3200 years from the ‘historical’ period (cycles 21–23) marked with a black oval.

The historical maxima and minima of the solar activity in the past are marked by the horizontal brackets.
