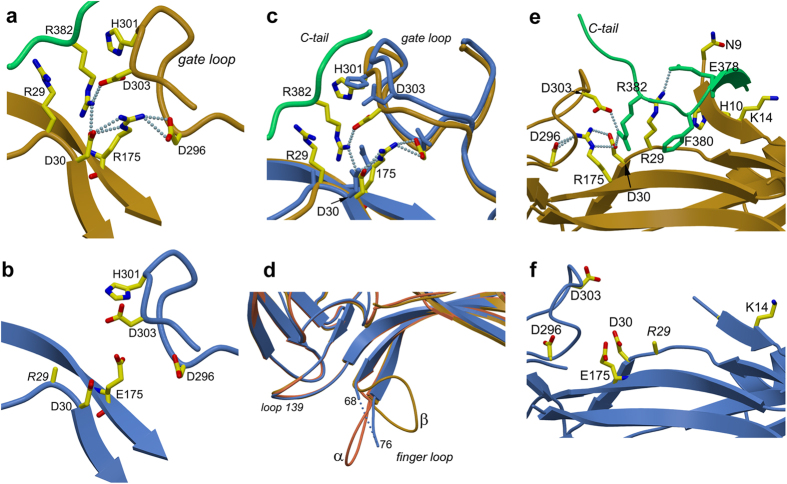
Figure 2.
Structural differences between arr-1 (PDB ID 3UGX, molecule A) and R175E. (a) The hydrogen bond network in arr-1 around Arg 175 linking residues (shown in stick model) from polar core, gate loop and the C-tail (shown in green). Hydrogen bonds are shown as blue dotted lines (for clarity, h-bonds shown are ≤3.2 Å) (b) R175E polar core region shows a complete collapse of the hydrogen bond network (c) superposition of arr-1 and R175E showing differences in the polar core region. Gate loop in R175E shows an outward shift and the residues of this loop show different rotamers. Additionally, E175 is exposed, and the side chain of R29 is truncated beyond Cβ position due to missing electron density. (d) Superposition of arr-1 and R175E showing the finger loop and loop 139. Both, α (extended, as in molecule B in PDB ID 3UGX, orange) and β (bent, as in molecule A in PDB ID 3UGX, gold) conformations are seen in arr-1. In R175E, no electron density could be traced for residues 69 to 75 of the loop that is likely disordered (shown in dotted blue line). (e) Anchoring of C-tail and three-element interaction in arr-1 showing hydrogen-bond interactions between residues from the polar core region, the N-terminus and the C-tail. (f) In R175E, showing absence of hydrogen bond interactions between the polar core residues and the C-tail as well as surface exposure of the residues. Also, note the antiparallel positioning of the C-tail in panel e where R382 is the terminal residue in arr-1 crystal structure to participate in the polar core network. Disruption of polar core in R175E releases R382, a major constraint that once released leads to enhanced C-tail flexibility. Energetically, this in turn can initiate the disruption of further H-bond interactions (between the C-tail residues 380, 379, 378 with the central residue R29; Supplementary Table S2), causing the R29 side chain to disorder.

