
Figure 1. Box-plot representing the Prakriti proportion of subjects with Vata (94), Pitta (75) and Kapha (93) dominant characteristics.
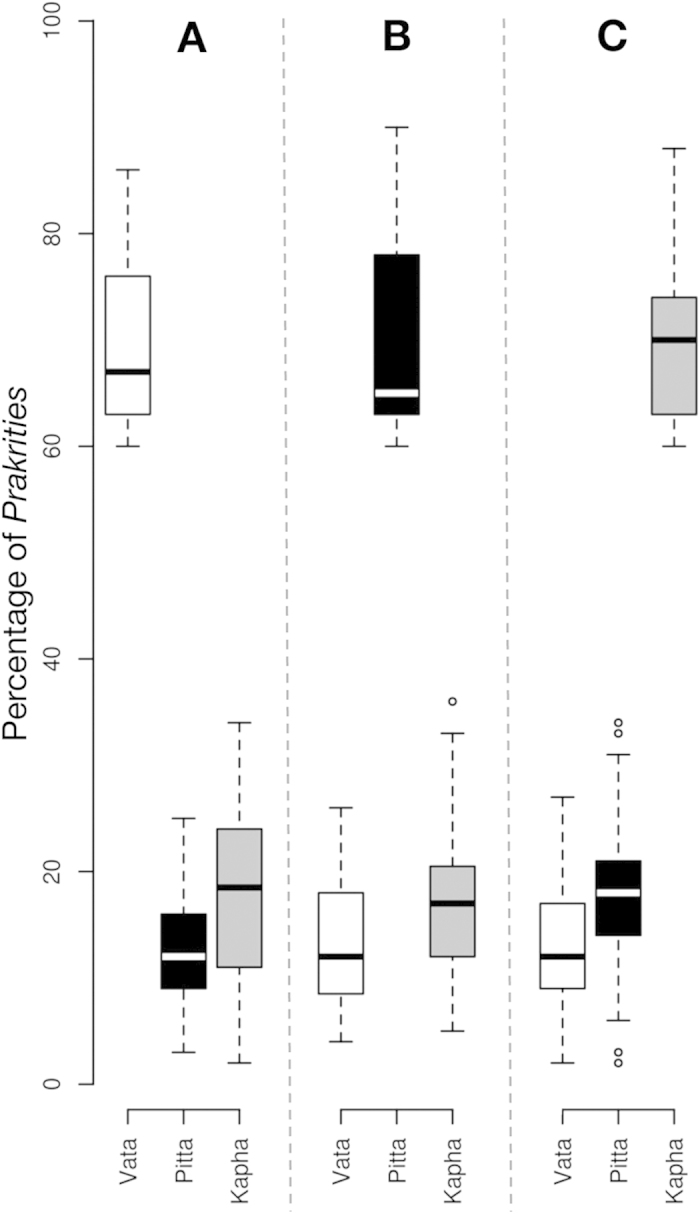
(A) Average percentage of Vata is 67%, while Pita and Kapha are 12% and 18.5%, respectively. (B) Average percentage of Pita is 65%, while Vata and Kapha are 12% and 17%, respectively. (C) Average percentage of Kapha is 70%, while Vata and Pita are 12% and 17%, respectively.