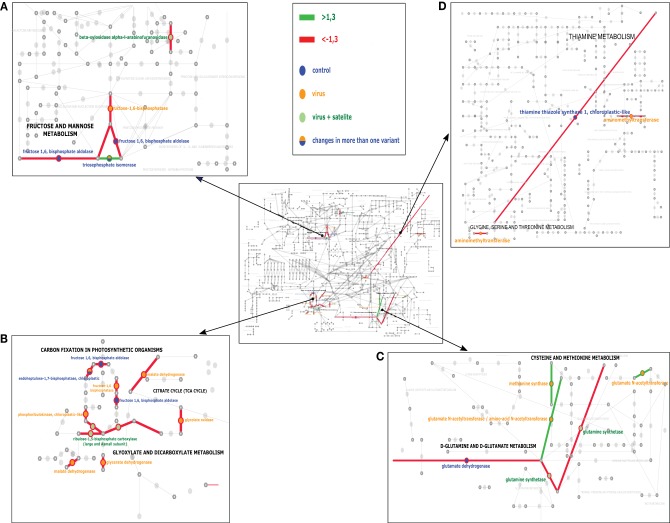
Figure 3.
The KEGG analysis of the pathways most affected at the experimental temperature for control (mock-inoculated) plants—blue, PSV-infected plants—yellow, and PSV plus satRNA-infected plants—green circles. Green and red lines indicate the pathways joined by the proteins which were found to be more abundant or less abundant (respectively). The middle panel shows the general view of the studied pathways. (A,B) focus on carbohydrate metabolism and (C,D) focus on amino acid metabolism.

