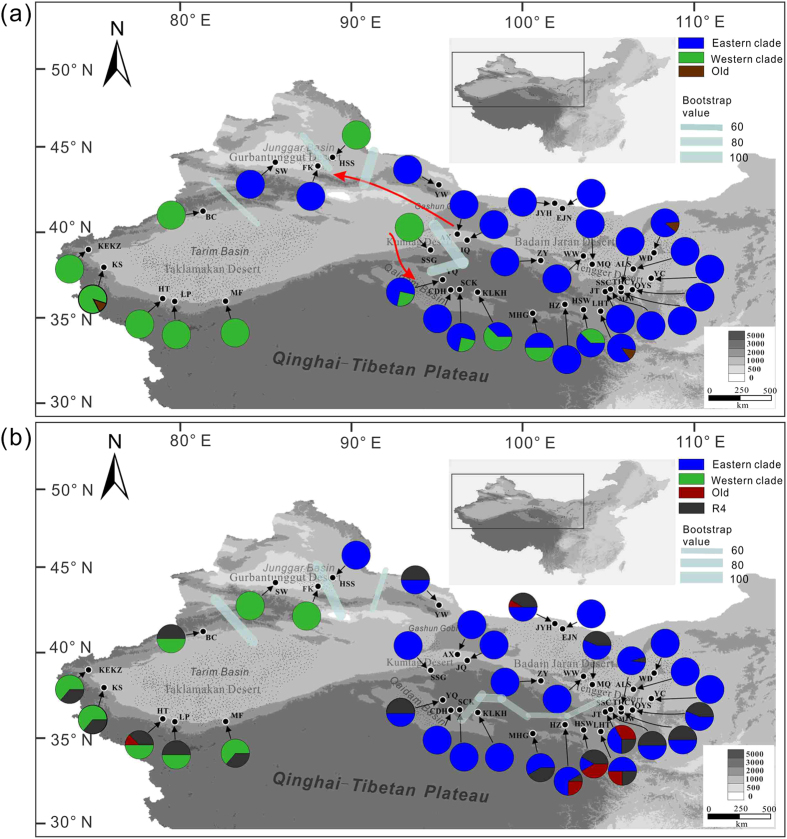
Figure 2. Geographical locations and haplotype distributions of the 34 R. soongarica populations examined in this study.
(a) cpDNA chlorotype distribution; (b) ITS ribotype distribution. Population locations are presented as small black spots with white margins; slice sizes are proportional to the frequency of the haplotypes (eastern or western clade). The colors of the pie diagrams correspond to the clades of the network genealogies in Fig. 1. “Old” refers to C26, C39 and C24. The gene flow along the East Asian winter monsoon (EAWM) and East Asian summer monsoon (EASM) directions are displayed with red arrow lines in (a). In addition, genetic barriers are superimposed on the map between populations using a gray bold line, with the width of the barrier lines representing the bootstrap values. These figures were drawn by H.X.Y. using CorelDraw X6 (Corel Corporation, Ottawa, Canada) after being originated from the software packages Diva-GIS version 7.5.0 (http://www.diva-gis.org/) loading with the Chinese map.

