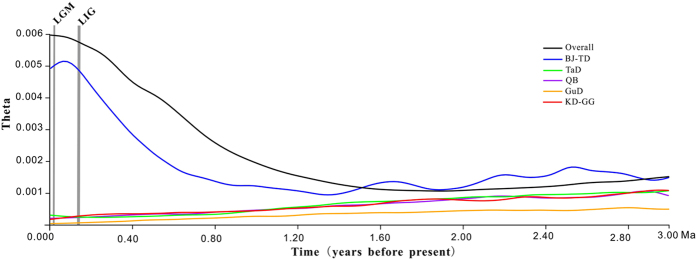
Figure 4. Skyline plots with MIGRATE-N estimated for each group of R. soongarica: x-axis, time, years before present (Mya); y-axis, theta (θ = 2Neu).

The curves shown in various colors are plotted for the total populations and separated populations distributed in BJ-TD, GuD, TaD, QB and KD-GG regions.
