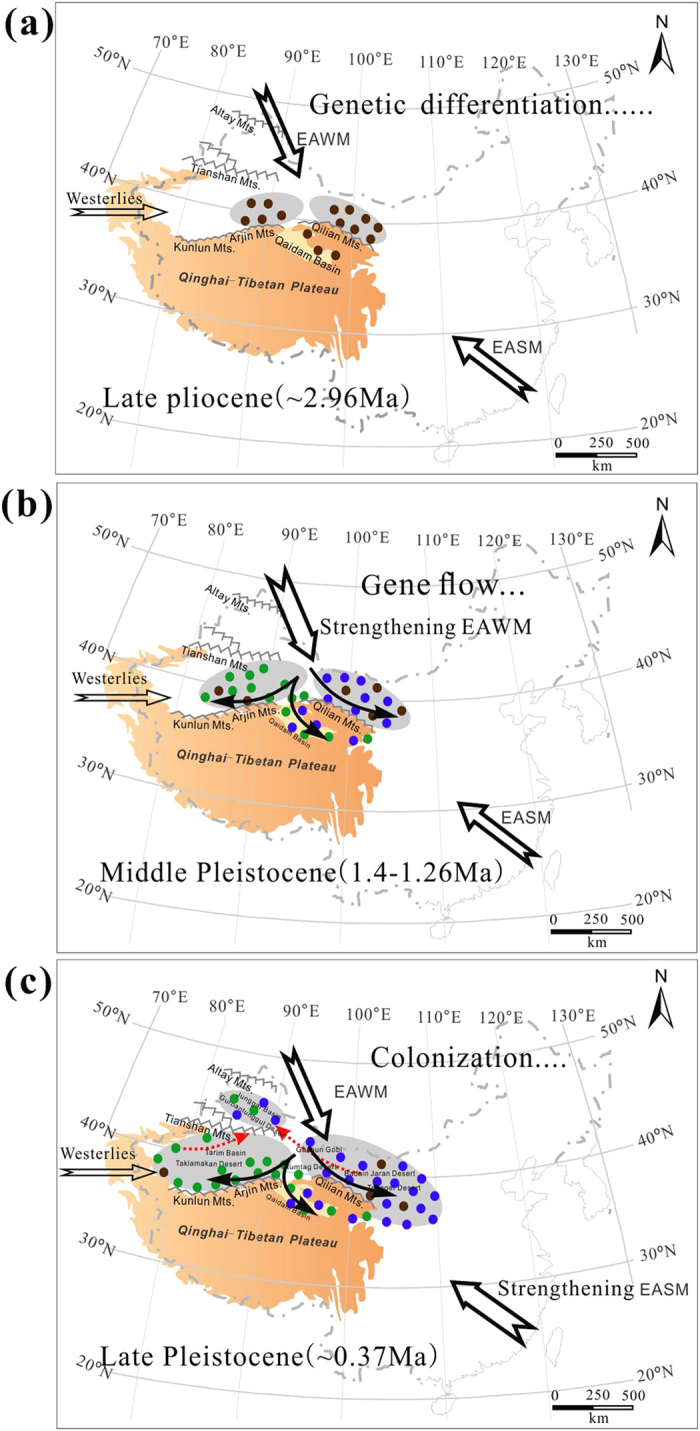
Figure 6. Historical schemes of spatial-temporal evolution historical schemes of paleogeologies and paleoclimatics and the corresponding genetic response of R. soongarica in the ACA region.

(a) ca. 2.96 Mya: genetic differentiation occurred within R. soongarica triggered by the uplift of the northeastern QTP and EAWM formation; (b) 1.4 ~ 1.26 Mya: maternal gene flow from the KD-GG region (SSG) to the QB and TaD regions under the driving force of the strengthening EAWM; the red line represents the orientation of gene flow; and (c) ca. 0.37 Mya: bi-directional colonization and aridification of the GuD region occurred; the dashed red line represents the directions of colonization. Color coding was consistent with Fig. 2 as follows: the brown spot represents the ancestor of R. soongarica, the blue pie represents the haplotyps from the eastern clade, and the green pie represents ones from the western clade. The shadow represents the expanding arid regions responding to the habitat changes of R. soongarica during different geological periods. These figures were drawn by H.X.Y. using CorelDraw X6 (Corel Corporation, Ottawa, Canada).
