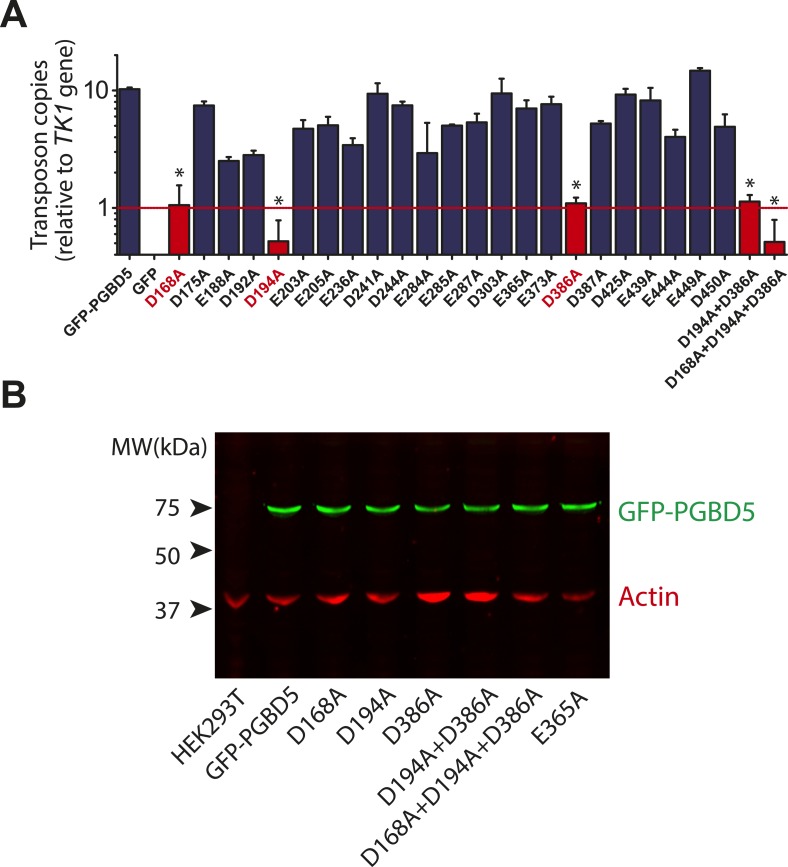
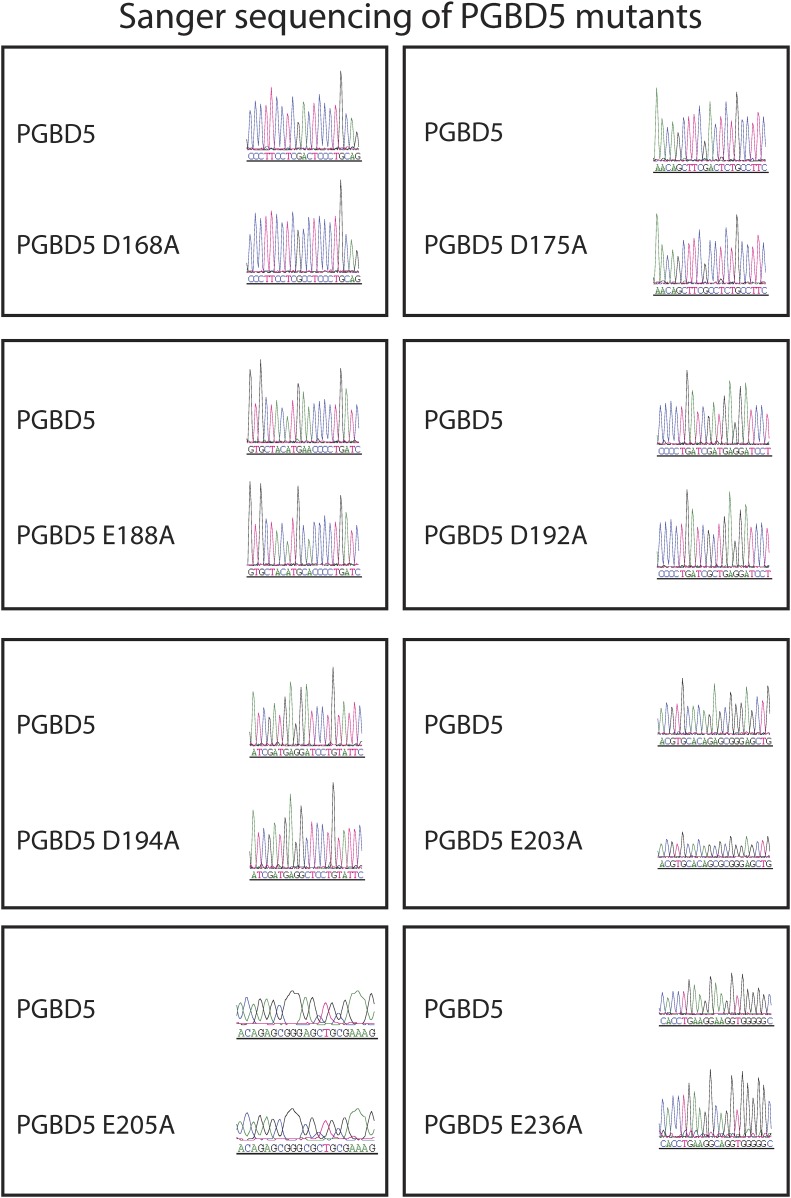
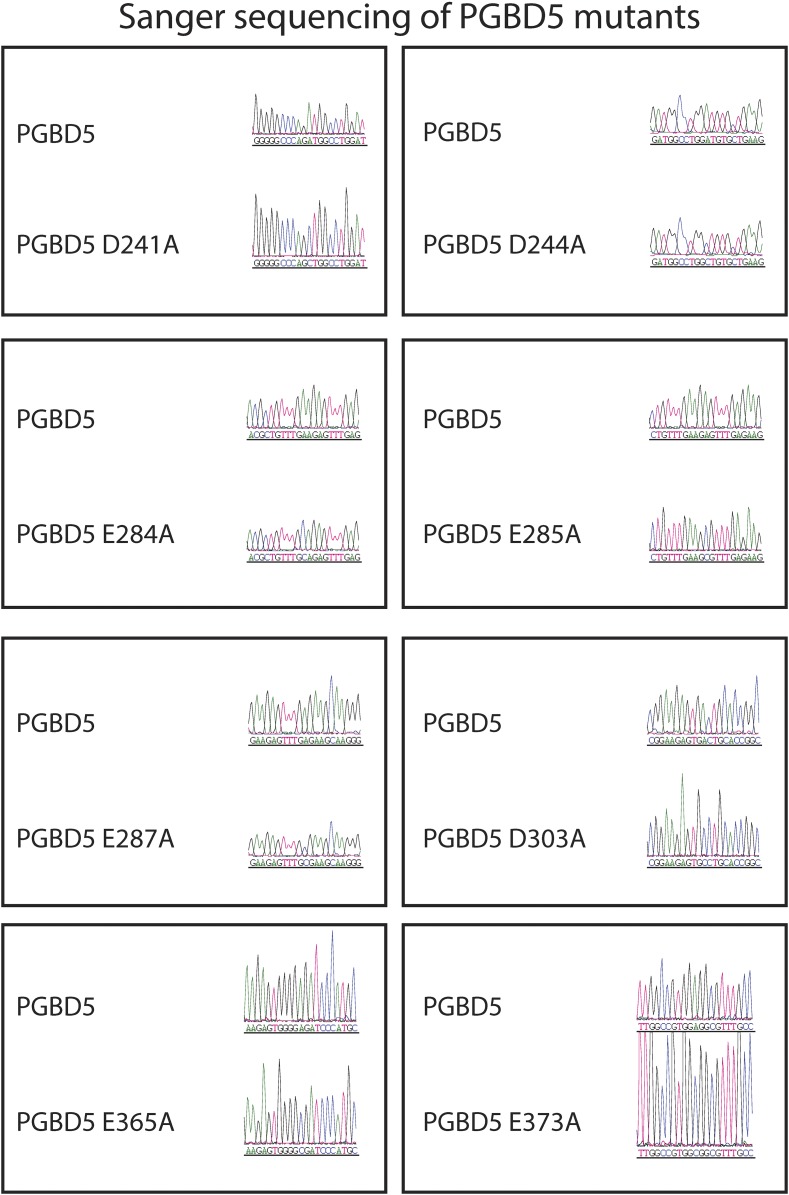
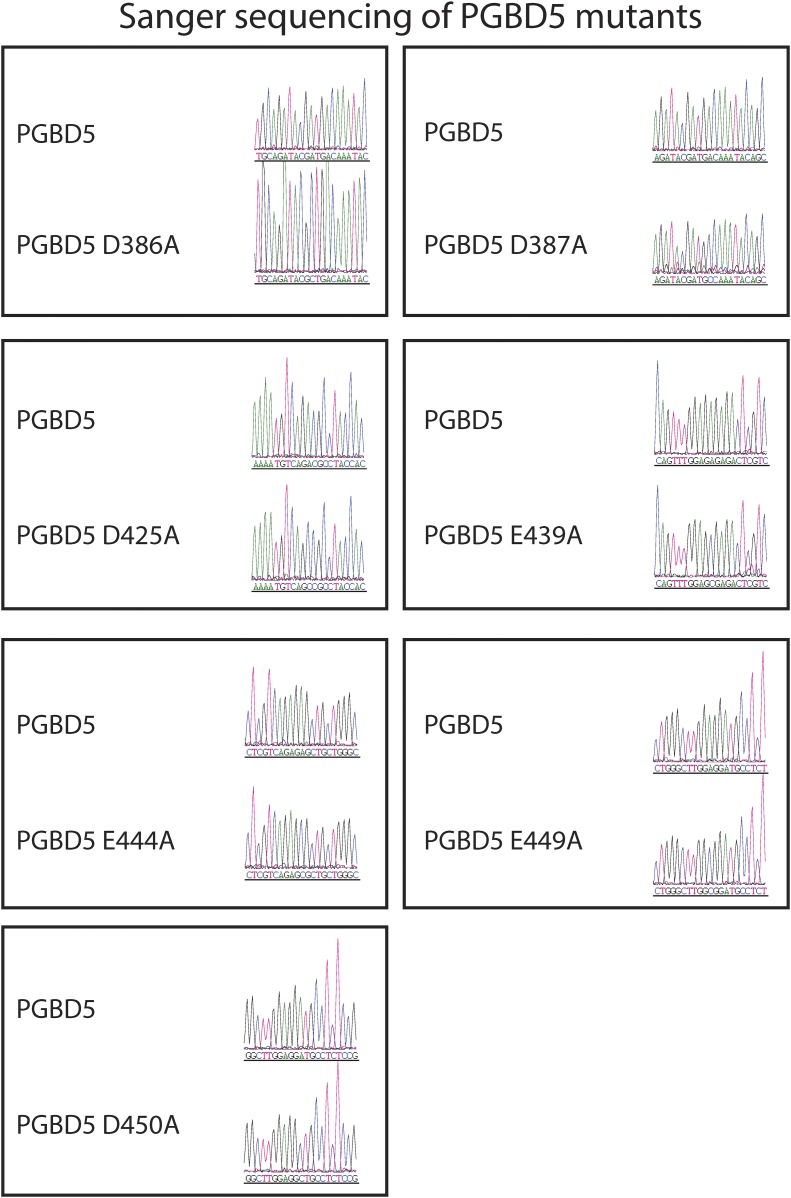
Figure 7. Structure-function analysis of PGBD5-induced DNA transposition using alanine scanning mutagenesis.
(A) Quantitative PCR analysis of genomic integration activity of alanine point mutants of GFP-PGBD5, as compared to wild-type and GFP control-expressing cells. D168A, D194A, and D386A mutants (red) exhibit significant reduction in apparent activity (Asterisks denote statistical significance: p = 0.00011, p = 0.000021, p = 0.000013 vs GFP-PGBD5, respectively). Dotted line marks threshold at which less than 1 transposon copy was detected per haploid human genome. Error bars represent standard errors of the mean of 3 biological replicates. (B) Western immunoblot showing equal expression of GFP-PGBD5 mutants, as compared to wild-type GFP-PGBD5 (green). β-actin (red) serves as loading control.


