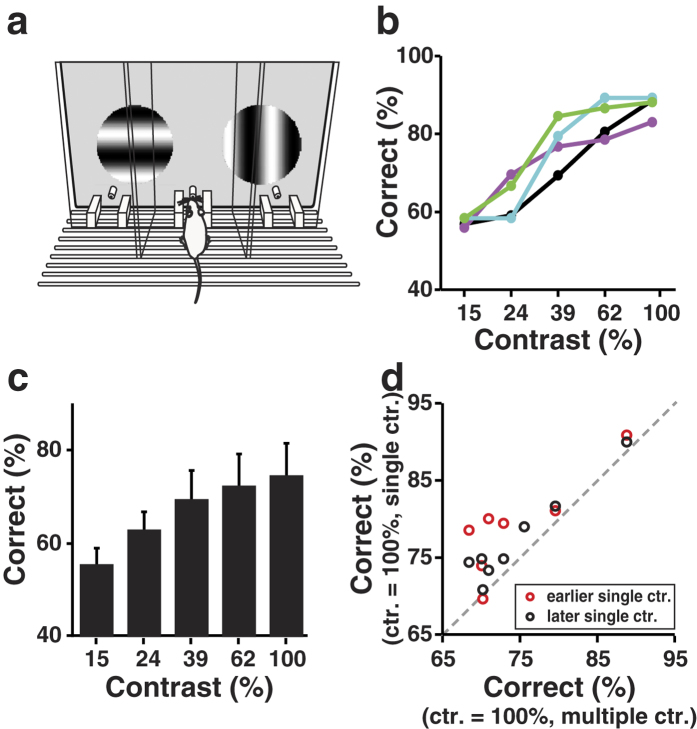
Figure 1. Dependence of orientation discrimination performance on contrast in the 2AFC task.
(a) Schematic illustration of the behavioural apparatus. (b) Performance in the multiple contrast condition for an example mouse. Each color represents one session. (c) Correct rate at each contrast in the multiple contrast condition. Spearman’s rank correlation coefficient r = 1, one-tailed P = 0.008; P = 2.4 × 10⁻⁷ for ANOVA. Error bars, s.d., n = 8 mice. (d) Comparison of performance at 100% contrast between the single contrast condition and the multiple contrast condition. Dashed line, the diagonal line. Red (black) circles represent the earlier (later) single contrast condition tested before (after) the multiple contrast condition. P = 0.008 for red data points, P = 0.004 for black data points, one-tail, Wilcoxon signed rank test.

