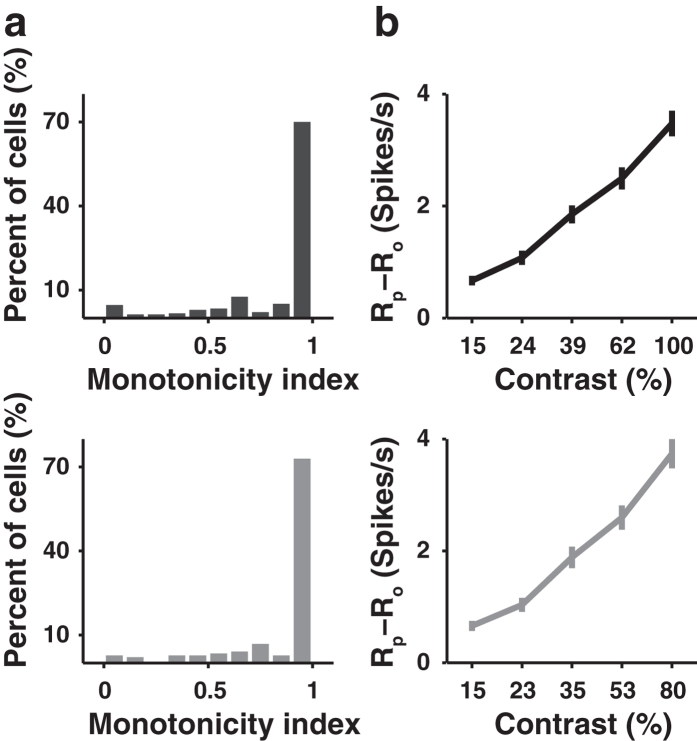
Figure 5. Dependence of P-O response difference on contrast for V1 neurons.
(a) Upper: distribution of monotonicity index for the responses measured with contrasts ranging from 15% to 100% (n = 237, including 188 neurons from anaesthetized mice and 49 neurons from awake mice). Lower: distribution of monotonicity index for the responses measured with contrasts ranging from 15% to 80% (n = 148 neurons from anaesthetized mice). (b) Response difference between preferred and orthogonal orientations averaged over all neurons. Upper: contrast range of 15% to 100%, Spearman’s rank correlation coefficient r = 1, P = 0.008, n = 237. Lower: contrast range of 15% to 80%, Spearman’s rank correlation coefficient r = 1, P = 0.008, n = 148. Error bars, s.e.m.

