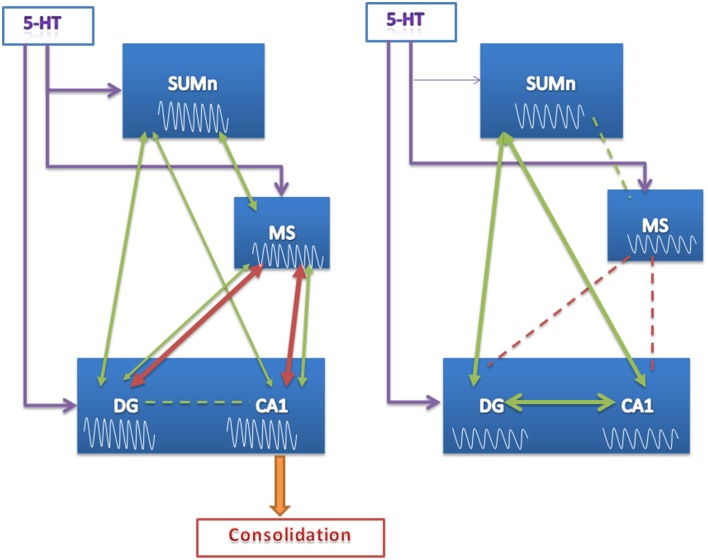
Figure 10.
Proposed model of function of the SUMn, the MS and the hippocampus circuit during learning after SUMn serotonin-depletion. The model represents the results observed principally the last days of training. EEG RP values are represented into the boxes, showing that no increase in high frequency RP was observed in the EXP group. Green arrows represent values of frequency peak; red arrows represent values of coherence. The thickness of the arrows represent the grade of coherence or correlation; broken lines represent the lack of coherence or correlation. When 5-HT was reduced in the SUMn, the circuit appear to entrain into a closed mode between SUMn and hippocampus. The lack of communication between MS and CA1 would impair the consolidation of memory.

