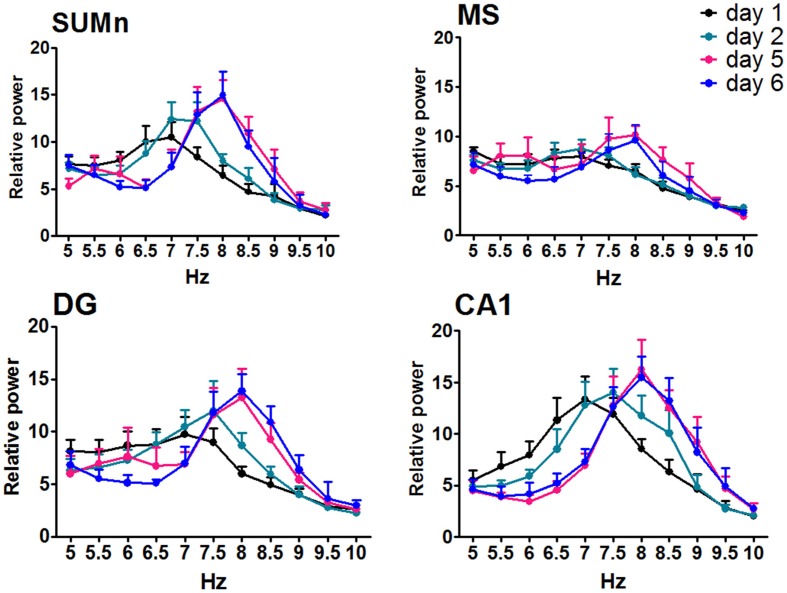
Figure 4.
Relative power in the theta band (5–10 Hz) recorded in the four regions of the CTR group during the searching of the platform across days of training. Only days 1, 2, and 5, 6 are showed. Mean ± SEM. Significant differences are listed in Table 1. p < 0.05.

