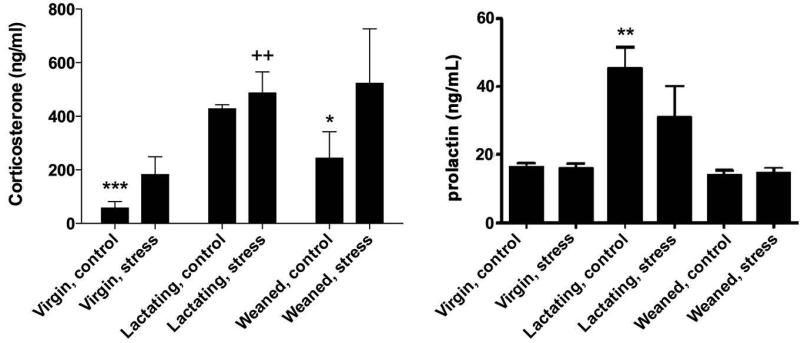
Figure 4. Corticosterone and prolactin plasma concentration in control and stressed rats.
Basal corticosterone and prolactin levels were increased in lactating rats compared to virgin and weaned cohorts (N=5, each), and were unchanged in response to restraint stress. Restraint-virgin rats showed a slight increase in corticosterone but it was not significantly different from control. Values represent mean ± SEM; for corticosterone graph: ***p< 0.0001, *p=0.0377 vs lactating control; ++p=0.0092 vs virgin stress; for prolactin graph: **p< 0.001 vs virgin and weaned controls. Data are presented as percent change ± SEM.

