. 2015 Sep 24;4:e10811. doi: 10.7554/eLife.10811

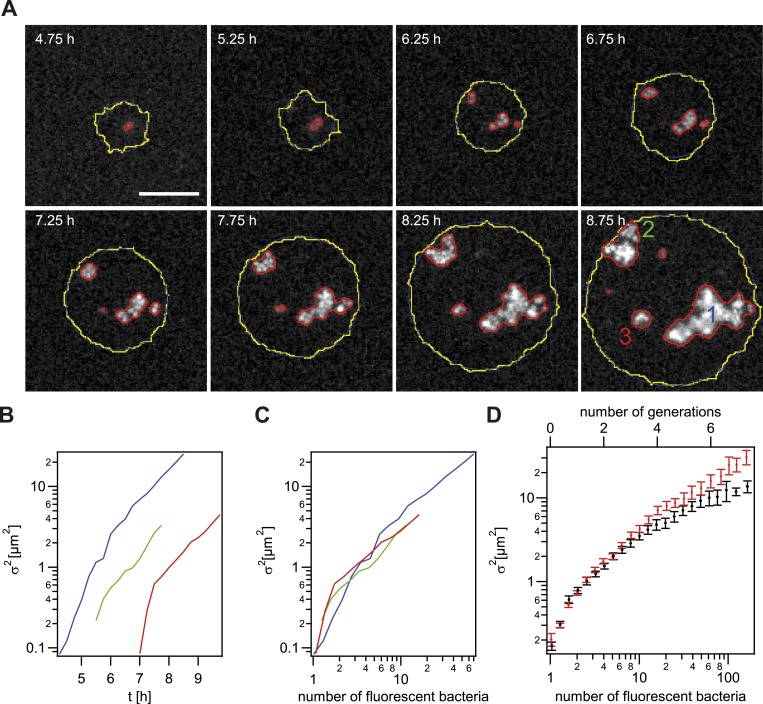
Figure 5. Spreading of new clones within an expanding colony.

gDNA from Pgreen was spread on the agar plate and wt cells were seeded. (A) Fluorescence time lapse. Yellow lines: front of the expanding colony. Red outlines: boundaries of sectors formed by the offspring of a single transformant. Scale bar: 10 µm. Spatial variance σ2=σx2+σy2   of three sectors as a function of (B) time and (C) number of offspring (fluorescent bacteria per sector). The colors correspond to the colors of the numbers at 8.75 hr. (D) Average variance of Pgreen (red) and P+ green (black) within the colony as a function of the number of offspring N. Error bars: standard error as obtained from >50 sectors for each condition.

DOI: http://dx.doi.org/10.7554/eLife.10811.011

Figure 5.

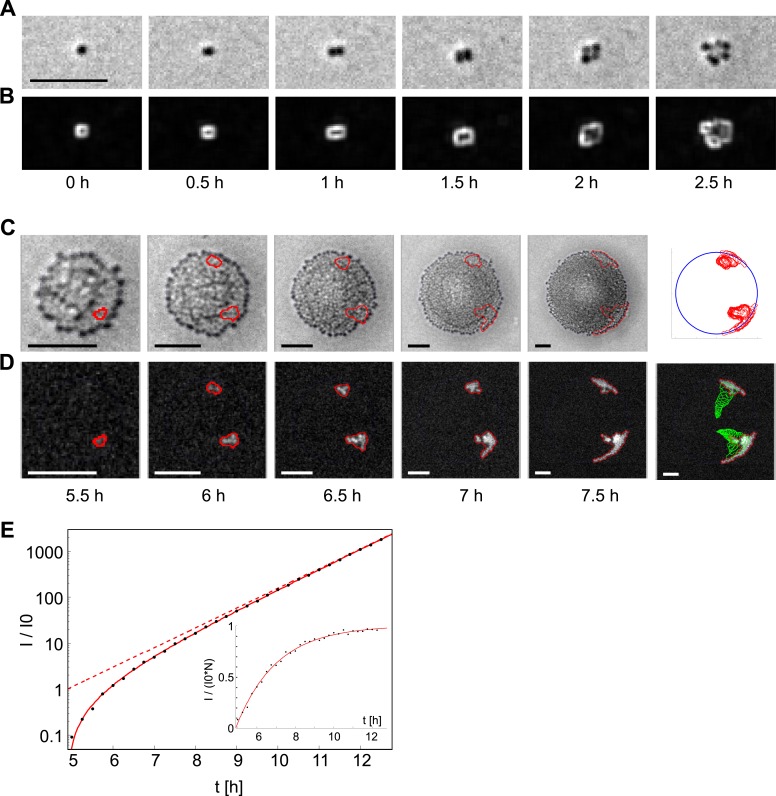
Figure 5—figure supplement 1. Analysis of the dynamics of the offspring of a single transformant.

Figure 5—figure supplement 1.

(A) Time-lapse in brightfield of a single cell growing into a colony. (B) Local intensity variance of the same cells. (C) Time-lapse of the same colony in brightfield keeping the proportion of colony radius to sub-image constant. Contour lines of emerging fluorescent patches are labeled in red. The last column shows all contour lines normalized by the colony radius and superimposed onto a unit-circle. (D) Fluorescence images showing contour of segmentation. The last column shows a superposition of all preceding contour lines (green) onto the fluorescence image of the final time-point. (E) Increase of fluorescence Itot over time normalized by the fit parameter of single cell fluorescence I0. The solid line is a fit onto the data. The dashed line gives the inferred number of fluorescent bacteria. The inset shows Itot normalized by I0 and N, that is, the normalized intensity per fluorescent bacterium. All scale bars: 10 µm.
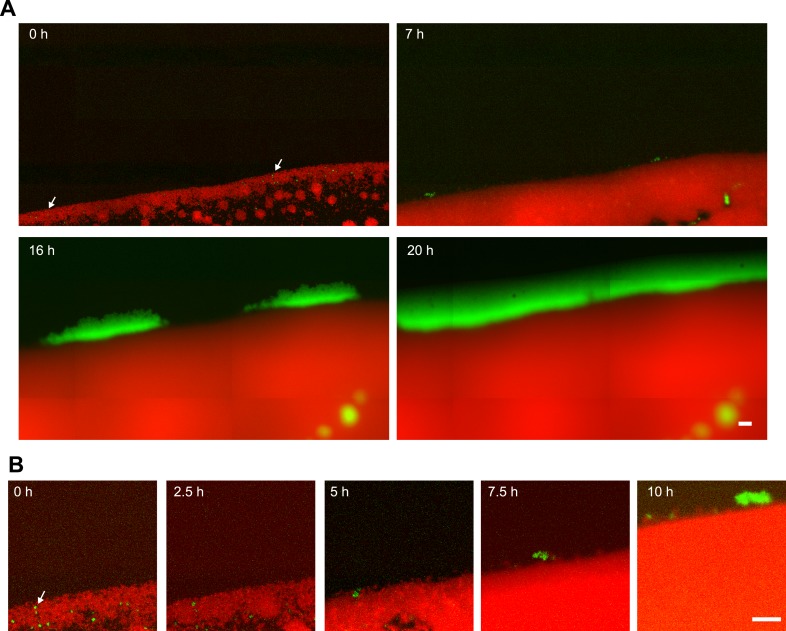
Figure 5—figure supplement 2. Segregation dynamics of non-piliated PQ− green from P+ red*.

Figure 5—figure supplement 2.

(A) pilQ deletion strain PQ− green was inoculated at low density with a higher density of P+ red*. (B) Zoom of (A). Scale bar: 20 µm. Arrows depict PQ− green bacteria that later spread ring-like along the expanding front.