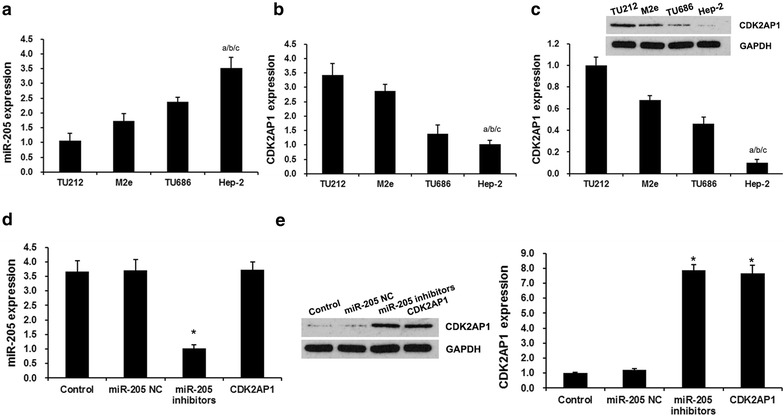
Fig. 2.

miR-205 was the upstream regulator of CDK2AP1. a miR-205 expression in LSCC cell lines. qRT-PCR analysis revealed miR-205 expression in TU212, TU686, M2e and Hep-2 cell lines. Error bars represent ± S.E. and ap < 0.01 versus TU212 cells. bp < 0.01 versus M2e cells. cp < 0.01 versus TU686 cells. b qRT-PCR analysis revealed CDK2AP1 expression in miR-205 expression in TU212, TU686, M2e and Hep-2 cell lines. c Western blot analysis CDK2AP1 expression in miR-205 expression in TU212, TU686, M2e and Hep-2 cell lines.Error bars represent ± SD and ap < 0.01 versus TU212 cells. bp < 0.01 versus M2e cells. cp < 0.01 versus TU686 cells. d qRT-PCR analysis revealed the effect of miR-205 and CDK2AP1 on miR-205 expression. e Western blot analysis revealed the effect of miR-205 and CDK2AP1 on CDK2AP1 expression. Hep-2 cells were transfected with miR-205 (miR-205 group) or miR-205 negtive control (miR-205 NC group) or CDK2AP1 (CDK2AP1 group). Error bars represent ± SD and *p < 0.01 versus control group
