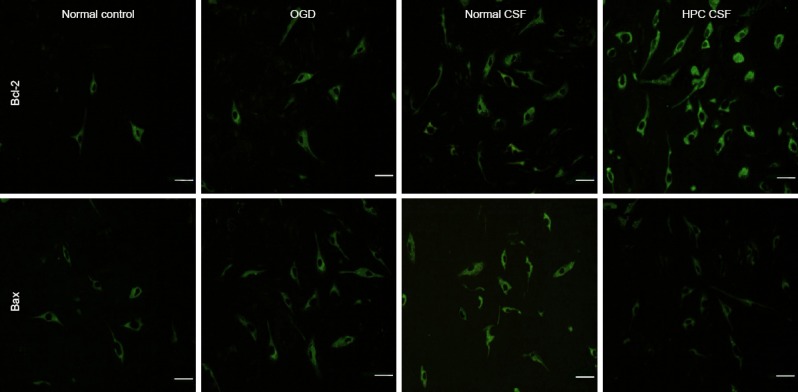
Figure 3.

Effects of HPC CSF on Bcl-2 and Bax expression in cultured cortical neurons exposed to OGD (immunofluorescence assay, confocal laser scanning microscopy).
The number of Bcl-2- and Bax-positive cells was less in the normal control and OGD groups. Fluorescence intensities of Bcl-2 and Bax immunolabeling and the numbers of Bcl-2 and Bax-positive cells were greater in the HPC CSF group than in the OGD and normal CSF groups. Scale bars: 50 μm. OGD: Oxygen glucose deprivation; CSF: cerebrospinal fluid; HPC CSF: CSF from rats given hypoxic preconditioning.
