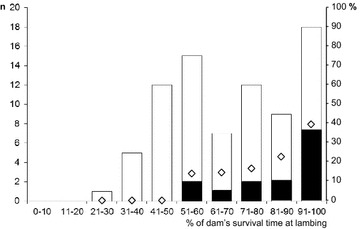
Figure 3.

Outcome of BSE infection in the offspring as a factor the proximity of lambing time to death of the dam. Black and white bars represent the number of lambs (Y1 axis) that did or did not develop BSE, respectively. Diamonds represent the same data as percentage (Y2 axis). Note that BSE infected progeny were born only to dams that lambed at 50% or later of their survival time and that the proportion of offspring that went on to develop BSE (efficient maternal transmission) increased with the proximity between parturition and death of the dam due to BSE.
