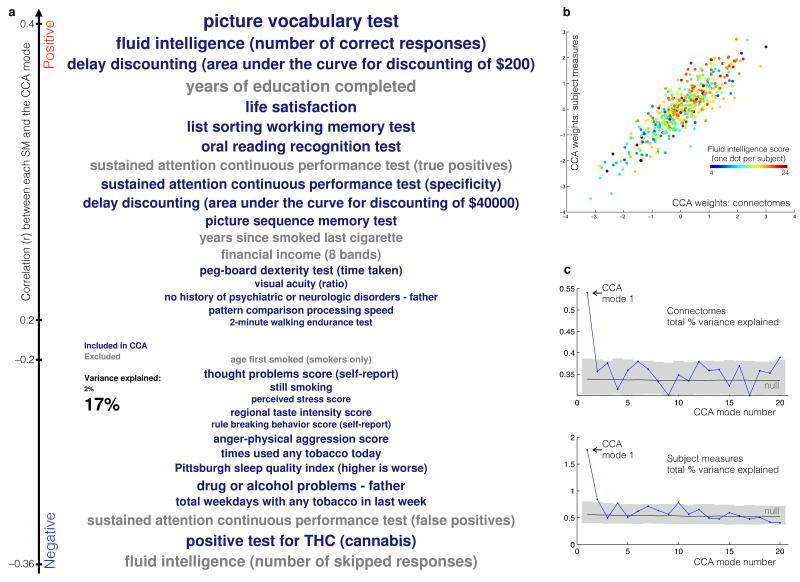
Figure 1.
(a) The set of SMs (subject measures) most strongly associated with the CCA mode of population variability. SMs included in the CCA are colored blue, while others (grey) were correlated with the CCA mode post-hoc. Vertical position is according to correlation with the CCA mode, while font size indicates SM variance explained by the CCA mode. Here we do not report “secondary” SMs that are highly redundant with those shown here (Supplementary Table 1 shows the complete set of SMs that correlate highly with the CCA mode). See wiki.humanconnectome.org/display/PublicData/HCP+Data+Dictionary+Public-+500+Subject+Release for details of the SMs. (b) The principal CCA mode - a scatter-plot of SM weights versus connectome weights, with one point per subject, and an example subject measure (fluid intelligence) indicated with different colors. The high correlation visualised here indicates significant co-variation between the two datasets. (c) The total variance explained of the original data matrices (shown separately for connectomes and subject measures) is plotted for the first 20 CCA modes. In black/grey is shown the mean and the 5th to 95th percentiles of the null distribution of the same measures, estimated via permutation testing. Using the null distributions to normalize variance explained accounts for the fact that the initial modes are expected to have higher correlations, even in the null scenario, but, as can be seen from the nulls, this is in any case a very small effect.

