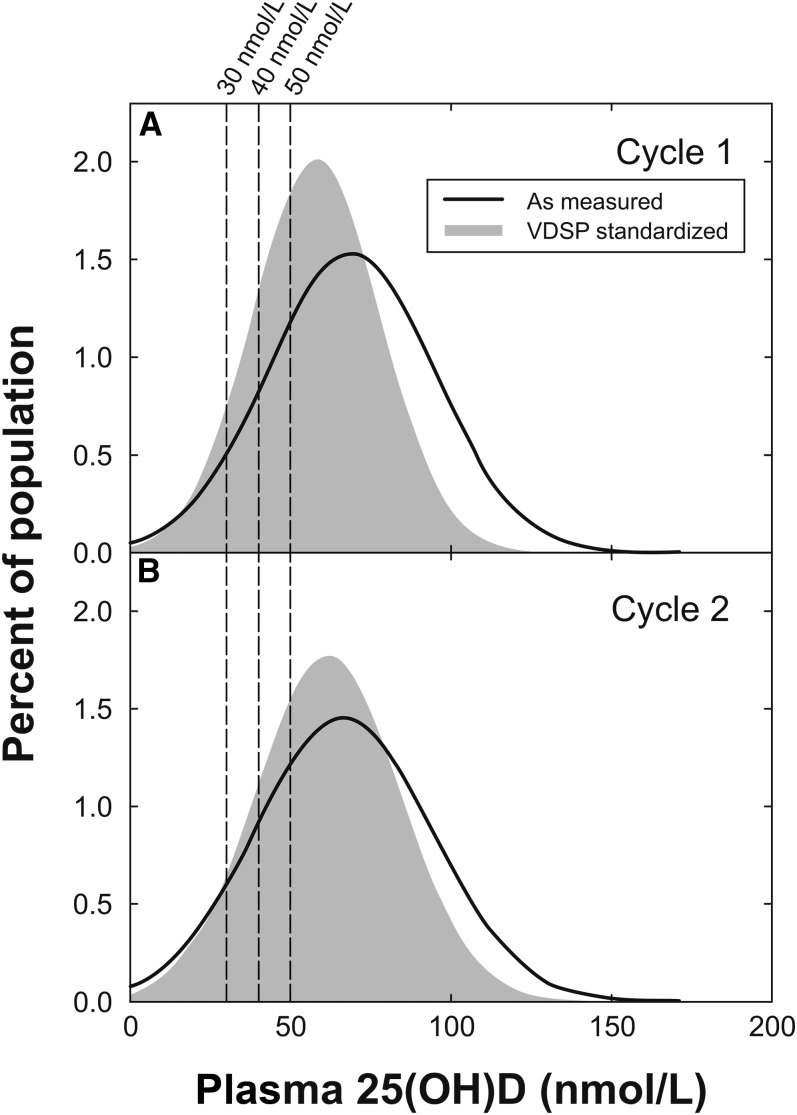
FIGURE 3.
Distribution of Canadian Health Measures Survey values (weighted for population representation) before (solid line) and after (filled gray) standardization by using Equation 1 for cycles 1 (A) and 2 (B). Vertical dashed lines show cutoff values of 30, 40, and 50 nmol/L. n = 5306 for cycle 1 and 6030 for cycle 2. VDSP, Vitamin D Standardization Program; 25(OH)D, 25-hydroxyvitamin D.

