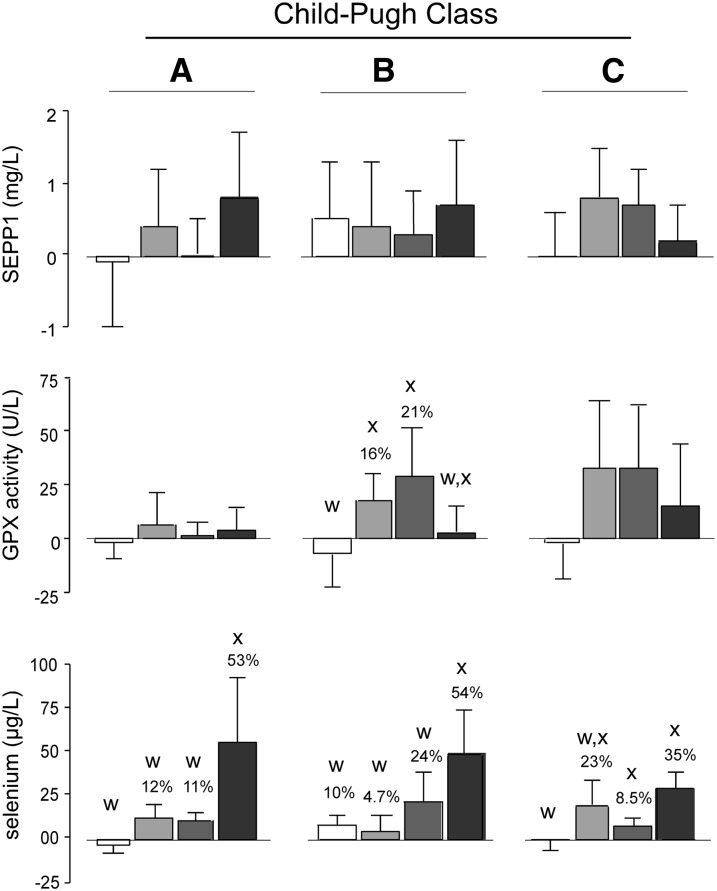
FIGURE 2.
Mean ± 1 SD effects of selenium supplementation on selenium biomarkers in patients with cirrhosis. Values represented by bars are means of differences between initial (baseline) and 4-wk values with 1 SDs indicated. Colors of bars designate supplement groups as follows: placebo (white); 200 μg Se as selenate (light gray); 400 μg Se as selenate (dark gray); and 200 μg Se as selenomethionine (black). The number of patient values included in each group calculation was 5–8; the exact numbers in each group are shown in Table 3. When significant differences between treatment values were detected within C-P classes with the use of the Kruskal-Wallis H test, letters are present above bars. Bars that do not share a common letter were significantly different at P < 0.05. Percentage values over bars within C-P classes containing significant differences between treatment values as determined with the use of the Kruskal-Wallis H test indicate how much the values were significantly increased (P < 0.05) by the supplement as determined with the use of Wilcoxon’s signed-rank test. GPX, glutathione peroxidase; SEPP1, selenoprotein P.

