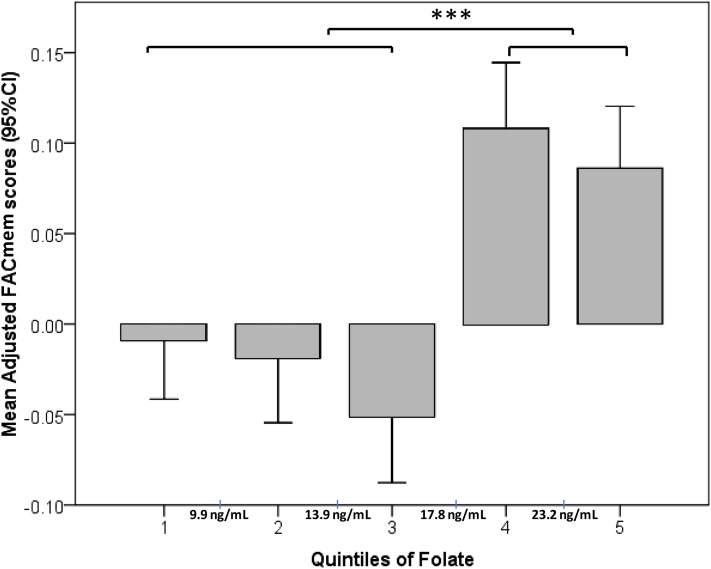
FIGURE 1.
Mean (95% CI) adjusted memory scores by quintiles of folate in the pooled cohort. The graph shows results of an ANOVA with Tukey post hoc testing for differences between mean adjusted memory scores by quintiles of plasma folate concentrations. n = 280/quintile. Memory scores were adjusted with the use of a multivariate linear regression for ethnicity, age, sex, education, estimated glomerular filtration rate, diabetes, hypertension, apolipoprotein E4 genotype, plasma total homocysteine, vitamin B-12, and vitamin B-6. Cutoff values between quintiles are marked on the x axis. ***P < 0.001. FACmem, factor score for memory.

