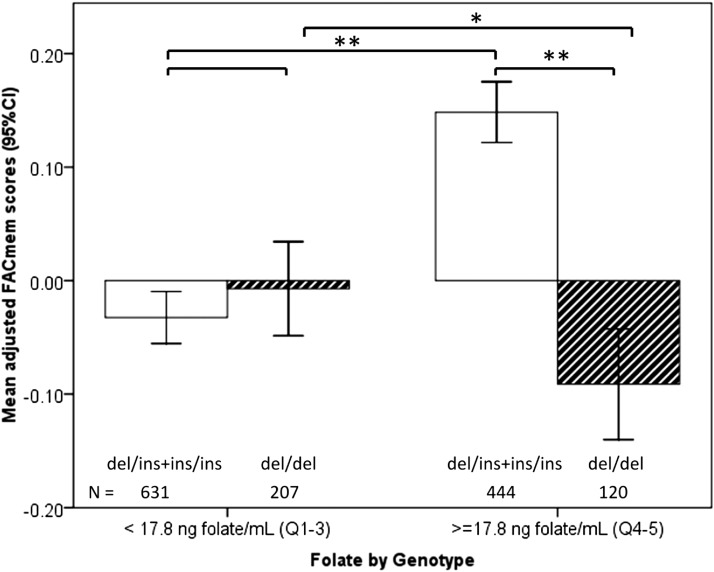
FIGURE 2.
Interaction of dihydrofolate reductase genotype and plasma folate with respect to memory in the pooled cohort. The graph shows results of a comparison of mean (95% CI) adjusted memory scores by genotype below and above the plasma folate cutoff of 17.8 ng folate/mL. Memory scores were adjusted in the general linear model for ethnicity, age, sex, education, estimated glomerular filtration rate, diabetes, hypertension, apolipoprotein E4 genotype, plasma total homocysteine, vitamin B-12, and vitamin B-6. *P < 0.05, ** P < 0.01. FACmem, factor score for memory.

