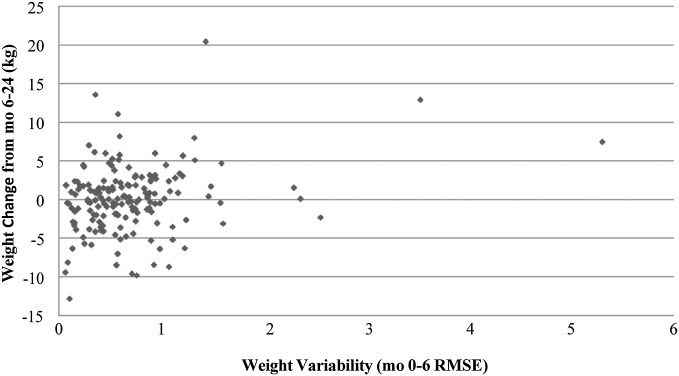
FIGURE 1.
Association between 6-mo weight variability (RMSE) and subsequent 18-mo weight change. Linear regression revealed a significant positive relation between weight variability from baseline to 6-mo and subsequent 18-mo weight change (b ± SE: 1.47 ± 0.43, P < 0.01; R2 = 0.06). The figure is a scatterplot illustrating this relation. RMSE, root mean square error of variation.

