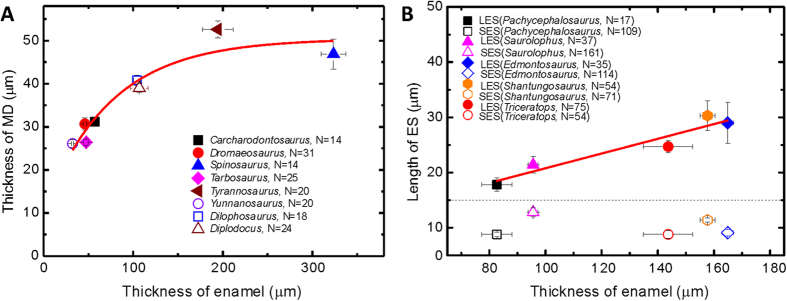
Figure 7. Quantitative analysis of the thicknesses of mantle dentin (MD) and enamel, as well as the lengths of long and short enamel spindles (LES and SES).

(A) Thickness relationships between MD and enamel of saurischian dinosaurs. Each data point was collected from randomly selected regions on each of the eight saurischian dinosaur teeth analyzed in this study. In this diagram, the thickness of MD is significantly correlated with the thickness of enamel as a y = a × (1 − exp(−x/t)) + b function. Where y is MD thickness, x is the enamel thickness, and a + b is the maximum MD thickness, which is about 50 μm. (B) The relationship between enamel spindle length and enamel thickness in ornithischian dinosaurs. Each data point was collected from three randomly selected regions on each of the five ornithischian dinosaur teeth analyzed in this study. The average lengths of the SESs of the five ornithischian dinosaurs were approximately 10 μm, and were not associated with the genera or enamel thicknesses. In contrast, the statistical lengths of the LESs ranged from 18 to 30 μm, linearly depending on the enamel thicknesses, which can be fitted by a linear function expressed as y = c + d × x. Where y is the length of LES, x is the enamel thickness, c is the intercept (7.46 μm), and d is the slope (0.14) of this function. Error bars represent 95% confidence intervals determined according to the Student’s t-test distribution.
