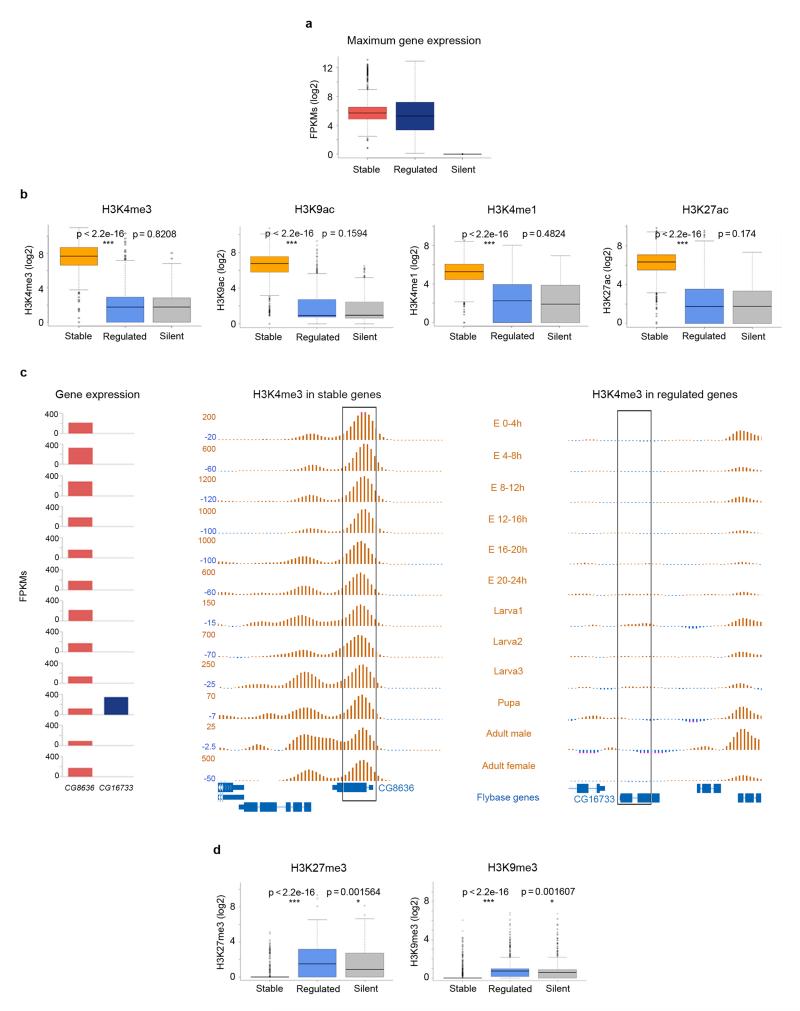
Figure 1. Distribution of histone modification levels in stable, regulated and silent genes during fly development.
a, Expression of stable, regulated, and silent genes during fly development at the time point of maximum expression for each gene. Gene expression was computed as FPKMs by the modENCODE consortium. The bottom and top of the boxes are the first and third quartiles, and the line within, the median. The whiskers denote the interval within 1.5 times the Inter Quartile Range (IQR) from the median. Outliers are plotted as dots. b, Normalized levels of H3K4me3, H3K9ac, H3K4me1 and H3K27ac at the time point of maximum expression during D. melanogaster development. These values represent the maximum height of the ChIPSeq peak within the gene body. P-values were computed using the Wilcoxon text (two-sided). c, Profiles of H3K4me3 during the 12 fly developmental time points in CG8636, a gene stably expressed during fly development, and CG16733, a pupa-specific gene. The expression (measured as FPKMs) along these points for the two genes is given on the left. d, Levels of H3K27me3 and H3K9me3 at the time point of maximum expression, computed as the average height of the ChIPSeq signal within the gene body, in stable, regulated and silent genes.

