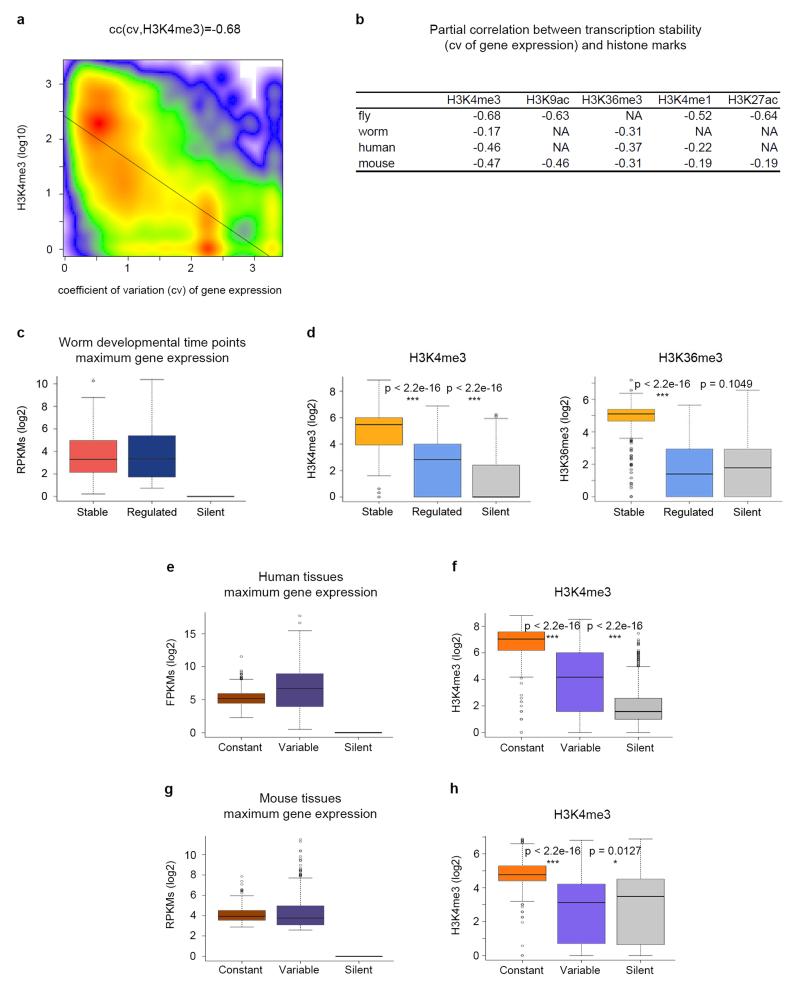
Figure 3. Association between histone modifications and transcription stability in metazoans.
a, Scatterplot of H3K4me3 levels at the time point of highest expression during fly development and transcriptional stability measured as the coefficient of variation of gene expression across time points. The correlation is computed as the partial correlation given gene expression. b, Partial correlations between active marks and transcription stability (the coefficient of variation). Correlations are computed controlling for gene expression. All correlations are statistically significant (p-value < 2.2e–16). P-values were computed using Student’s t-test (two-sided). c, Expression of stable, regulated and silent genes during worm development at the time point of maximum expression. The bottom and top of the boxes are the first and third quartiles, and the line within, the median. The whiskers denote the interval within 1.5 times the IQR from the median. Outliers are plotted as dots. d, Levels of H3K4me3 and H3K36me3 at the time point of maximum expression during worm development. e, Expression of genes with constant and variable expression at the tissue/cell line of highest expression across multiple samples from the Roadmap Epigenomics Mapping Consortium. f, Levels of H3K4me3 at the tissue of maximum expression. g, Expression of genes with constant and variable expression at the tissue of highest expression across ten mouse tissues from the mouse ENCODE project. h, Levels of H3K4me3 at the tissue of maximum expression. These levels correspond to the maximum height of the ChIPSeq peak within the gene body. P-values were computed using Wilcoxon text (two-sided).

