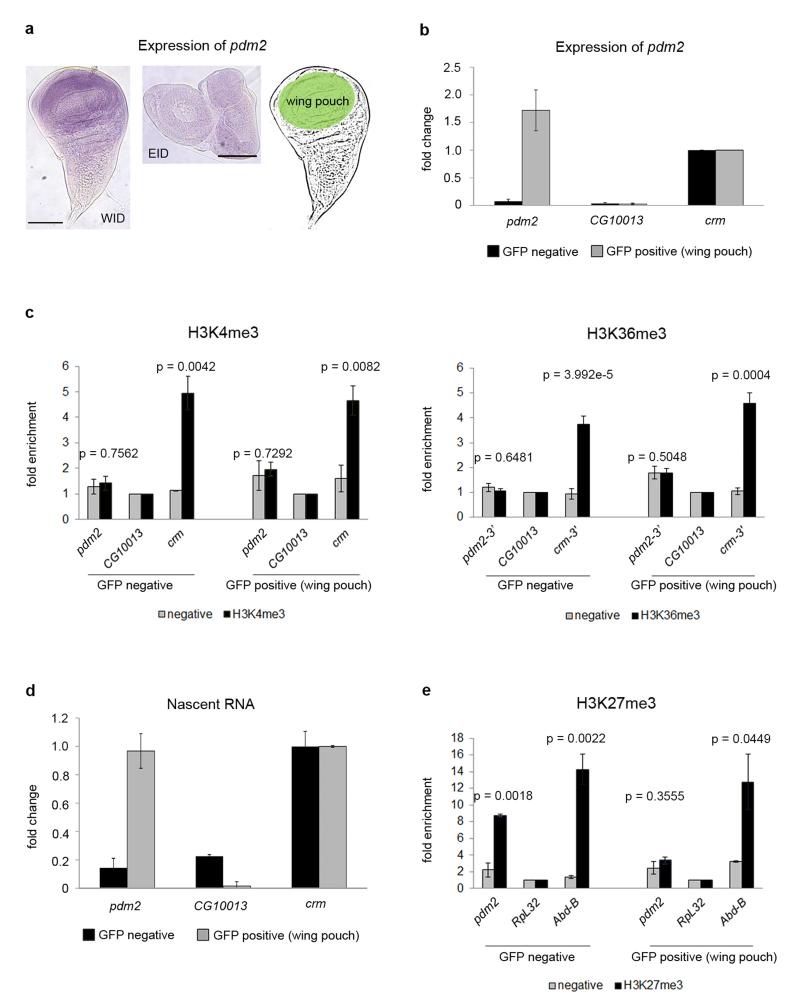
Figure 6. Active transcription of pdm2 without chromatin modifications.
a, Expression of pdm2 in WID (left panel) and EID (middle panel) labeled with a pdm2-specific probe. The gene is only expressed in the wing pouch of the WID, highlighted in green. The scale bars represent 100 μm. b, Expression of pdm2 in sorted cells analyzed by qPCR. Gene expression is normalized by the control gene crm. Error bars represent the SEM from three biological replicates. c, ChIP analysis of H3K4me3, H3K36me3 and of negative controls without antibody on sorted cells. ChIPs are represented as enrichment of the marks over a silent gene non-marked with H3K4me3 and H3K36me3 (CG10013). Crm is used as positive control for these modifications. Error bars represent the SEM from at least three biological replicates. P-values were computed using the Student’s t-test (two-sided). d, Newly transcribed RNA of GFP-sorted cells. Nascent RNA is normalized by the control gene crm. Error bars represent the SEM of four biological replicates. e, ChIP analysis of H3K27me3 and of negative controls without antibody on sorted cells. H3K27me3 ChIPs are represented as enrichment of the mark over a constitutively expressed gene non-marked with H3K27me3 (RpL32). Abd-B is used as positive control for this modification. Error bars represent the SEM from at least three biological replicates.

