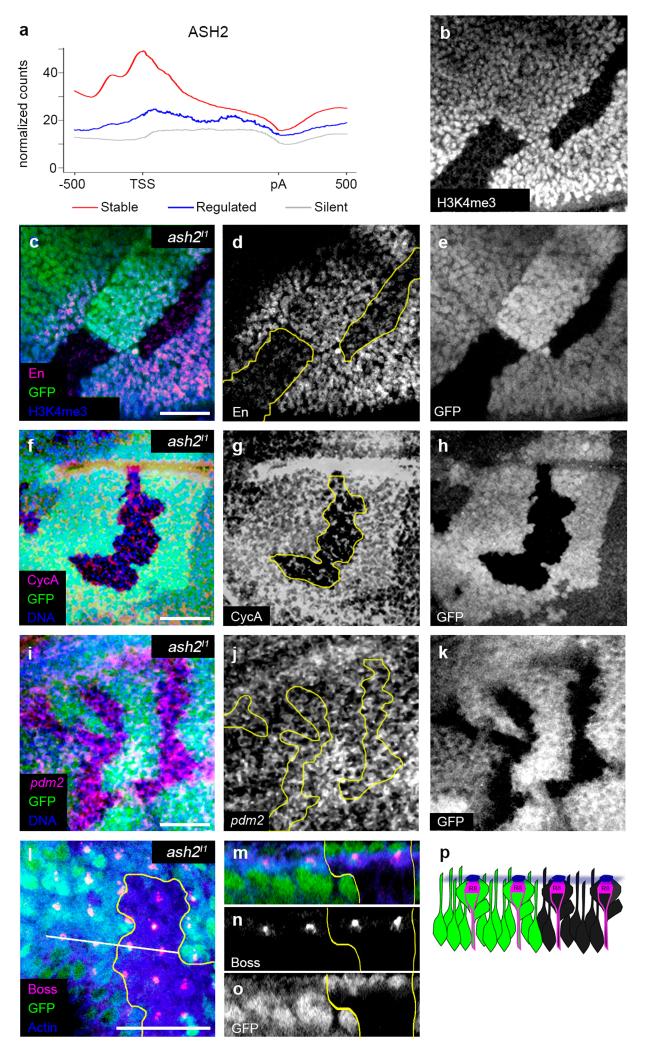
Figure 7. Reduction of H3K4me3 does not affect expression of regulated genes.
a, Distribution of ASH2 binding in stable (red), regulated (blue) and silent genes (grey). b, H3K4me3 is strongly decreased in ash2I1 mutant clones in WID. c, En immunostaining in WID (merged). The scale bar represents 20 μm. d, The levels of the stable gene En are reduced in mutant clones. e, GFP negative cells indicate ash2I1 mutant cells in c and d. f, CycA immunostaining in WID (merged). The scale bar represents 20 μm. g, CycA is decreased in ash2I1 mutant clones. h, GFP negative cells indicate ash2I1 mutant cells in f and g. i, pdm2 fluorescence in situ hybridization in ash2I1 mutant clones in WID (merged). The scale bar represents 20 μm. j, No changes in pdm2 expression are observed in ash2I1 mutant clones. k, GFP negative cells indicate ash2I1 mutant cells in i and j. l, Boss immunostaining in EID. The scale bar represents 20 μm. m, Optical cross-section (white line in l) showing Boss in all R8 photoreceptor cells (merged). n, No changes in Boss expression are observed in ash2I1 mutant clones. o, GFP negative cells indicate ash2I1 mutant cells in m and n. p, Diagram summarizing the result in m–o. Green cells express the wild-type ash2 allele and black cells correspond to homozygous ash2I1 mutant cells. Boss (magenta cap) localizes in the apical side of R8.

