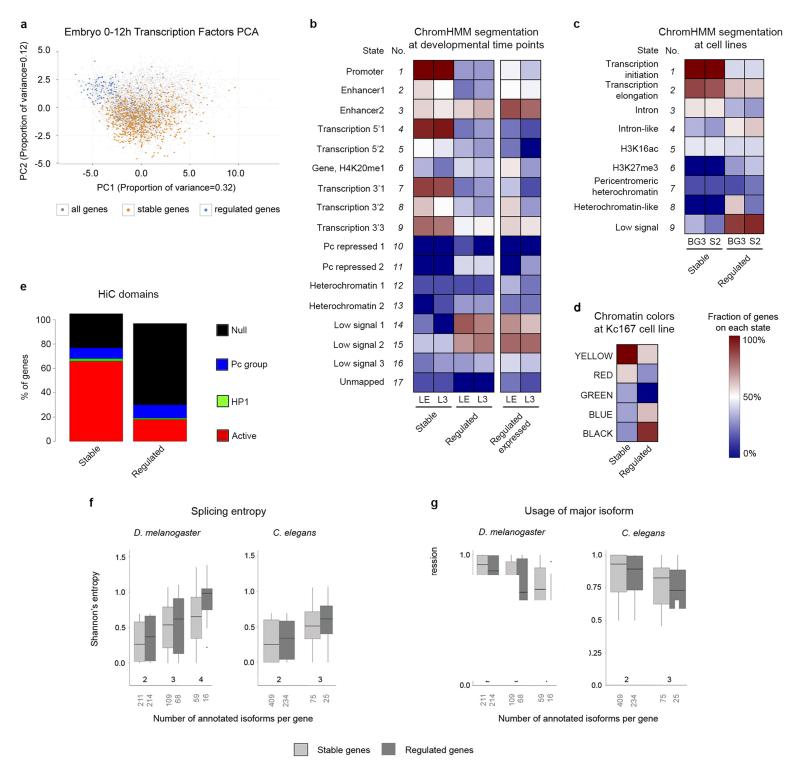
Figure 8. Promoter architecture and genome organization in stable and developmentally regulated genes.
a, Principal Component Analysis (PCA) of genes expressed in the Drosophila embryo between 0 and 12h, based on ChIP-chip binding profiles of twenty transcription factors. b, Fraction of stable and regulated genes in different states from chromatin segmentations in Late Embryo (LE) and L343. Right, proportion of regulated genes when considering only genes expressed in LE or L3. c, The same as in b, for segmentations in BG3 and S2 cell lines42. d, The same as in b, for the segmentation in Kc16741. BLACK chromatin corresponds to repressive chromatin. YELLOW and RED chromatin is typical of transcriptionally active regions. GREEN and BLUE chromatin correspond to repressive chromatin. e, Proportion of stable and regulated genes mapping to spatial chromatin domains, considering the 1,169 domains inferred by HiC in fly embryos44. f, Distribution of Shannon’s entropy of splicing in stable and regulated genes. Shannon’s entropy is computed at the developmental time point in which gene expression is the maximum. The number of genes of each category appears below the X-axis. The bottom and top of the boxes are the first and third quartiles, and the line within, the median. The whiskers denote the interval within 1.5 times the IQR from the median. Outliers are plotted as dots. g, Distribution of the relative usage of the major isoform. The Y-axis is the fraction of the total transcriptional output of the gene that is captured by the most abundant isoform.

