
Fig. 6.
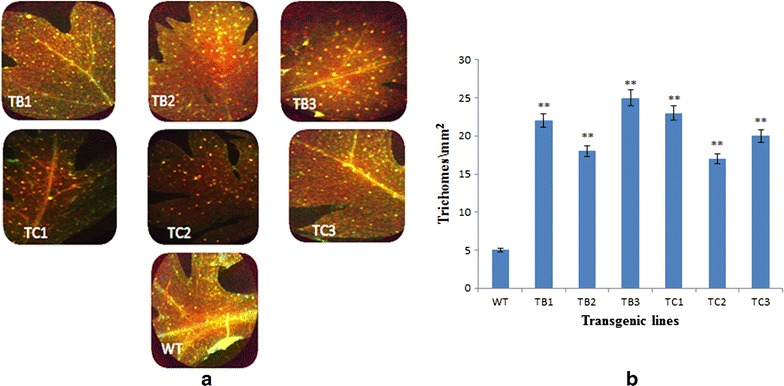
a Trichome density: comparison of trichome density of transformed and untransformed plants of A. annua. TB1–TB3 represent rol B transgenics whereas TC1–TC3 represent transgenics of rol C gene. WT represents the control plant of A. annua. b Graphical representation of trichomes density of wild type A. annua and transformants of rol B and rol C gene