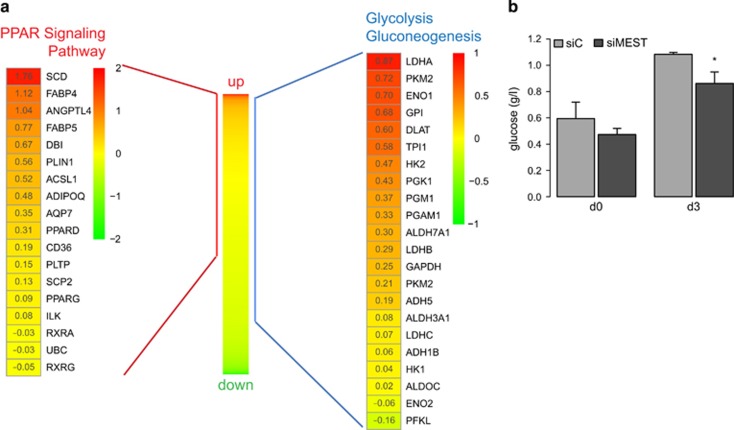
Figure 3.
MEST depletion induces PPAR signalling and glycolysis pathways. hMADS cells were transfected at confluence (d-2) with siRNAs targeting MEST (siMEST) or a control siRNA (siC). Adipocyte differentiation was induced 2 days later (d0). (a) RNA from cells at d3 was analysed by microarray to obtain a global view of mRNAs that are responsive to MEST depletion. A total of 2278 unique RefSeq mRNAs was sorted according to differences in expression between siMEST- and siC-transfected cells (middle heat map). Gene set enrichment analysis (GSEA preranked) revealed a significant enrichment of the KEGG pathways ‘PPAR signaling' (false discovery rate (FDR) q-value<0.0001) and ‘glycolysis/gluconeogenesis' (FDR q-value=0.0001) among upregulated transcripts. Expression of the transcripts assorted to both pathways are shown as heat maps (log2-transformed expression ratios (siMEST/siC). (b) Supernatants of hMADS cells at d0 and d3 were analysed for glucose concentration (n=5, *P<0.05).

