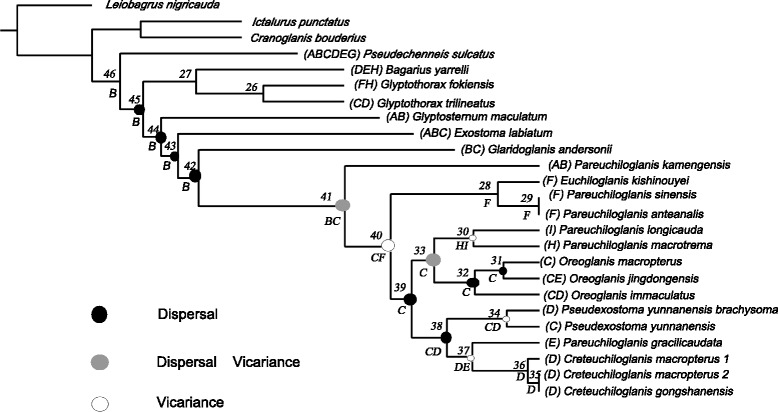
Fig. 4.

Results from the Dispersal-Extinction-Cladogenesis (DEC) analysis using the software RASP (Yu et al. [56]). Nodes of interest are marked by circles, assigned a unique number, and shaded according to the divergence process assigned. In this context, circles in gray represent nodes in which both vicariant and dispersal events were assigned. Note that incomplete lineage sorting and uncertainty regarding the ancestral node distribution reduce the robustness of the assignment. Letters below circles represent the distribution range with the highest probability; refer to the text for discussion on the robustness of these inferences
