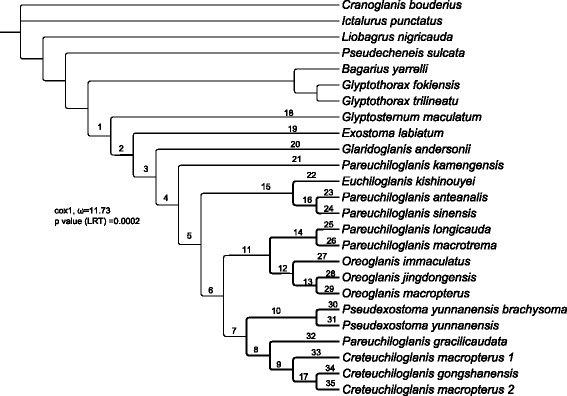
Fig. 6.

Detection of positively selected codon sites in the complete mitochondrial protein genes (excluding ND6). The MrBayes tree topology (Fig. 2) was used for this analysis. “ωpss” represents the ω value of positively selected sites. “P-value (LRT)” represents the p-value of the likelihood ratio test of the alternative hypothesis (ωpss = MLE) and the null hypothesis (ωpss = 1). The branches in which positively selected codon sites were detected are indicated by bold black lines
