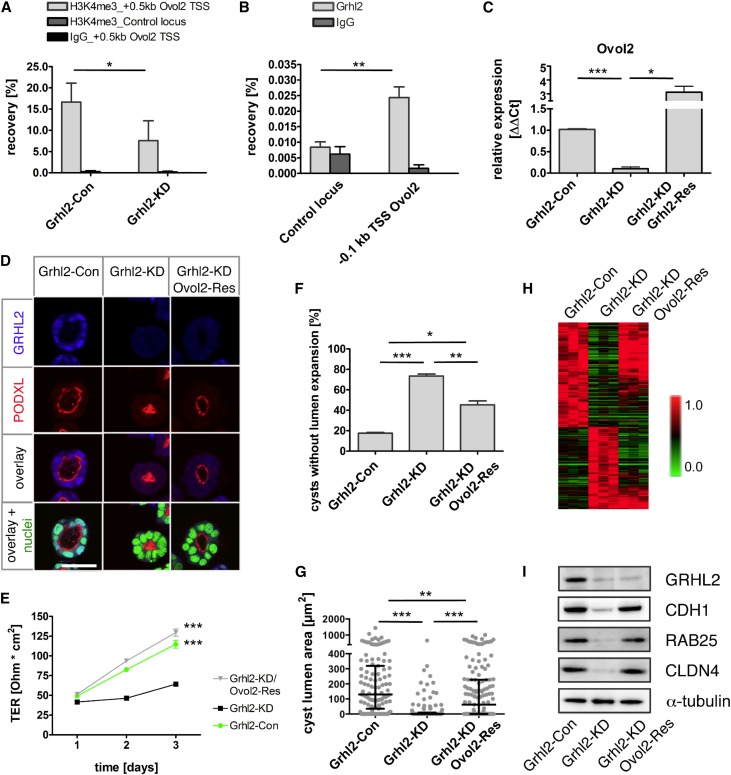
Figure 5.
Re-expression of Ovol2 after Grhl2 knockdown rescues lumen formation and reinduces GRHL2-dependent genes. (A) Validation of differential H3K4 trimethylation at the Ovol2 TSS between Grhl2-KD and Grhl2-Con cells using ChIP-quantitative PCR. Shown are mean values of percent recovery ±SD. Primers amplified a region in the H3K4me3 peak area, 0.5 kb downstream of Ovol2 TSS. Chromatin is amplified for a negative control locus. IgG is used as negative antibody control. (B) ChIP-quantitative PCR using an antibody against GRHL2 reveals an enrichment at the Ovol2 promoter (0.1 kb upstream of Ovol2 TSS) compared with a negative control locus in IMCD-3 chromatin. (C) mRNA expression of Ovol2 is analyzed using quantitative RT-PCR in Grhl2-KD, Grhl2-Con, and Grhl2-KD; Grhl2-Res cells (mean±SEM). (D) After 5 days of culture in Matrigel, cysts from Grhl2-Con, Grhl2-KD, and Grhl2-KD; Ovol2-Res cells are immunofluorescence stained and analyzed by confocal microscopy. Representative cysts stained with antibodies against GRHL2 and PODXL are shown. Nuclei are counterstained using SYTOXGreen. (E) Grhl2-Con, Grhl2-KD, and Grhl2-KD; Ovol2-Res cells are grown on polycarbonate membranes. Measurements of TER are shown for the indicated days (mean±SEM). (F and G) Cysts grown in Matrigel for 5 days are analyzed for lumen formation. (F) Percentages of cysts that did not develop a single open lumen are shown (mean±SEM). (G) Areas generated from sections with the largest lumen diameter are calculated for every cyst (median and IQR). (H) Microarray gene expression analysis is performed on Grhl2-Con (n=3), Grhl2-KD (n=3), and Grhl2-KD; Ovol2-Res (n=3) cells. The top 250 differentially expressed genes are hierarchically clustered (Pearson correlation, average linkage clustering). Note substantial reinduction of Grhl2-dependent genes in Grhl2-KD cells after Ovol2 overexpression. (I) Western blots for CDH1, GRHL2, CLDN4, and RAB25 are performed on Grhl2-Con, Grhl2-KD, and Grhl2-KD; Ovol2-Res cells. α-Tubulin is used as the loading control. *P<0.05; **P<0.01; ***P<0.001. TSS, transcriptional start site; IQR, interquartile range; ΔΔCt, difference in cycle threshold. Bar, 38 µm in D.

